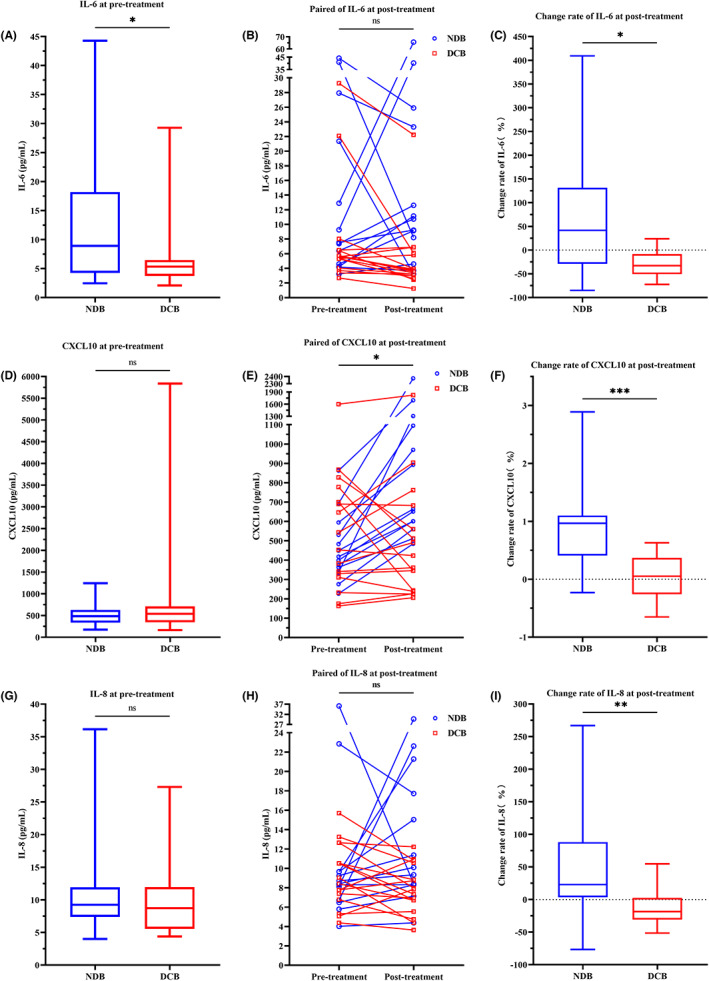
FIGURE 1.

Comparison of IL‐6, CXCL 10 and IL‐8 in the full cohort. (A, D, G). Box plot showing difference in pretreatment level between NDB and DCB patients. (B, E, H). Line series showing dynamics before and after ICI treatment. (C, F, I) Box plot showing difference of change rates between DCB and NDB patients. *p < 0.05, **p < 0.01, ***p < 0.001; ns stands for non‐significance.
