FIGURE 3.

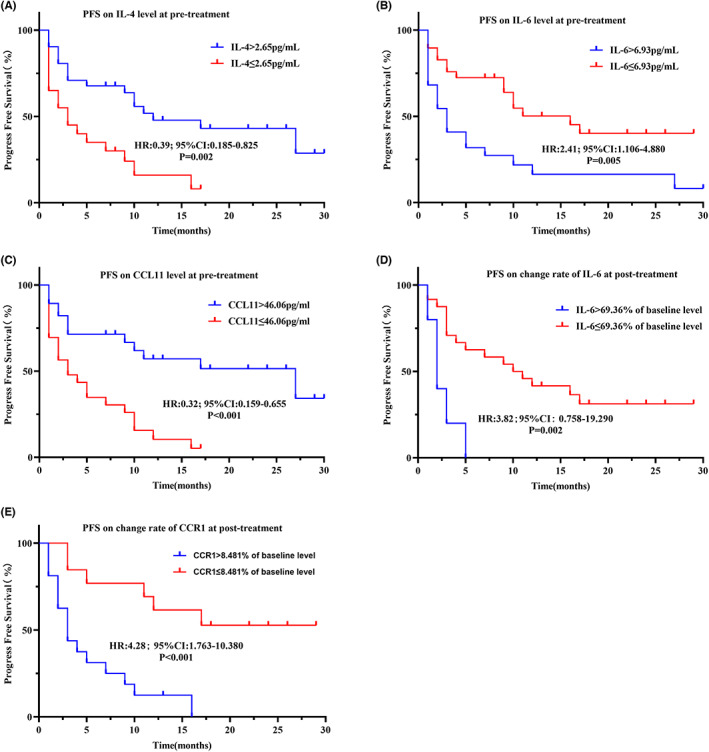
Kaplan–Meier curves illustrating differences in prognosis in the full cohort. PFS based on IL‐4 level at pretreatment (A), IL‐6 level at pretreatment (B), CCL11 level at pretreatment (C), change rate of IL‐6 (D), change rate of CCR1 (E).

Kaplan–Meier curves illustrating differences in prognosis in the full cohort. PFS based on IL‐4 level at pretreatment (A), IL‐6 level at pretreatment (B), CCL11 level at pretreatment (C), change rate of IL‐6 (D), change rate of CCR1 (E).