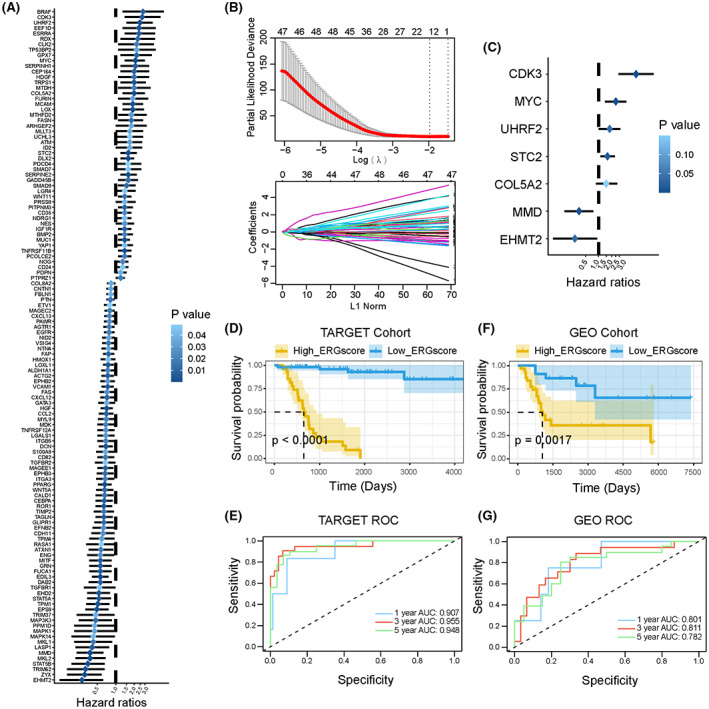
FIGURE 1.

Construction of a survival‐related signature based on EMT‐related genes (ERGs). (A) The forest plot of 124 independent prognostic genes in OS patients (p < 0.05). Hazard ratios (HR) and p‐value were calculated by univariate Cox regression analysis. The deeper the blue, the greater the significance. (B) LASSO algorithm confirmed minimum lambda value. (C) The forest plot of seven EMT‐related genes in the optimal prognostic model constructed by stepwise multivariate Cox regression analysis. (D) Kaplan–Meier survival curves for OS patients with high‐ and low‐ERG scores in the TARGET cohort. (E) The ROC curves for 1‐, 3‐, and 5‐year survival of constructed ERG signature in the TARGET cohort. (F) Kaplan–Meier survival curves for OS patients with high‐ and low‐ERG scores in the GEO cohort. (G) The ROC curves for 1‐, 3‐, and 5‐year survival of constructed ERG signature in the GEO cohort.
