
FIGURE 3.
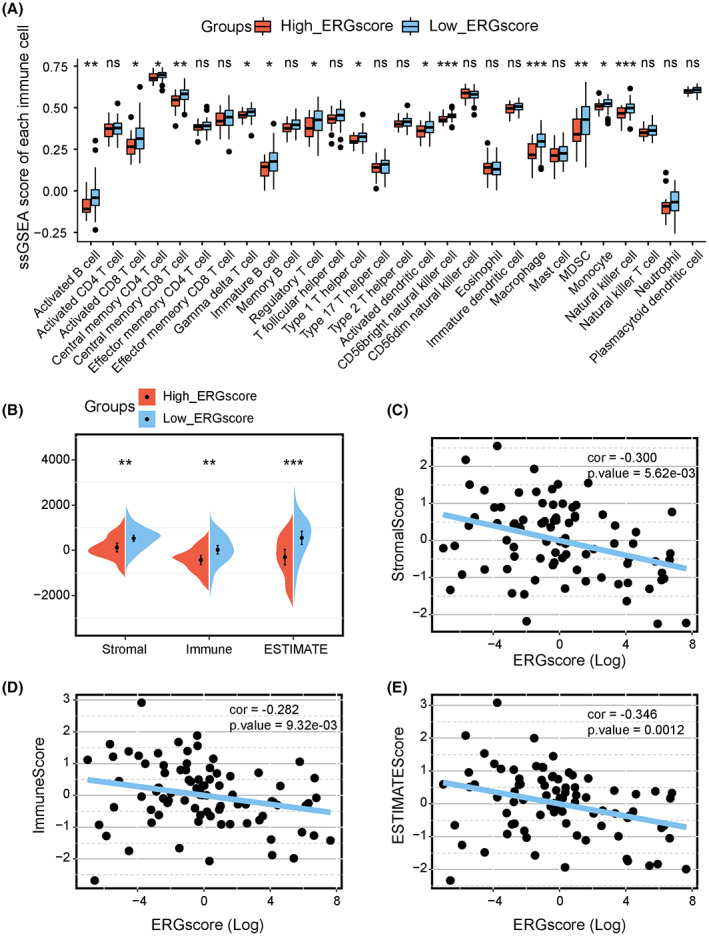
Associations of immune cell infiltration, ESTIMATE scores, and the ERG signature stratification. (A) Comparison of 28 immune cells expression abundance in high‐ and low‐ERG‐score groups based on ssGSEA analysis. (B) Comparison of Stromal, immune, and ESTIMATE scores in high‐ and low‐ERG‐score groups. Scatter plots show the spearman correlation between ERG score and stromal score (C), immune score (D), and ESTIMATE score (E). Kruskal test *p < 0.05; **p < 0.01; ***p < 0.001; ****p < 0.0001; ns, no significance.