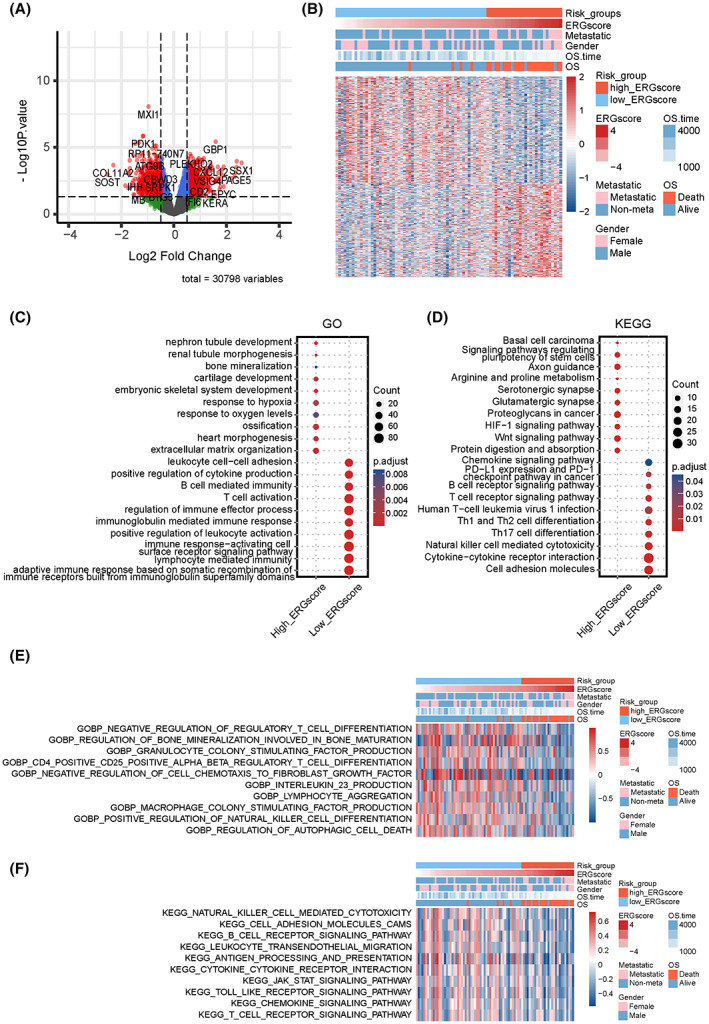
FIGURE 4.

Functional enrichment characteristics based on the ERG signature stratification. (A) Volcano plot of DEGs between high‐ and low‐ERG‐score groups. Red plots represent statistically significant DEGs (|logFC| > 0.5 and adjust.p < 0.05). (B) Heatmap of statistically significant DEGs between high‐ and low‐ERG‐score groups. Pivotal items of GO (C) and KEGG (D) enrichment analyses based on the marker genes (logFC >0.5 and adjust.p < 0.05) in high‐ and low‐ERG‐score groups. Heatmaps of GSVA analysis for ERG signature subgroups based on GO‐biological‐process (E) and KEGG (F) gene sets in the MSigDB database.
