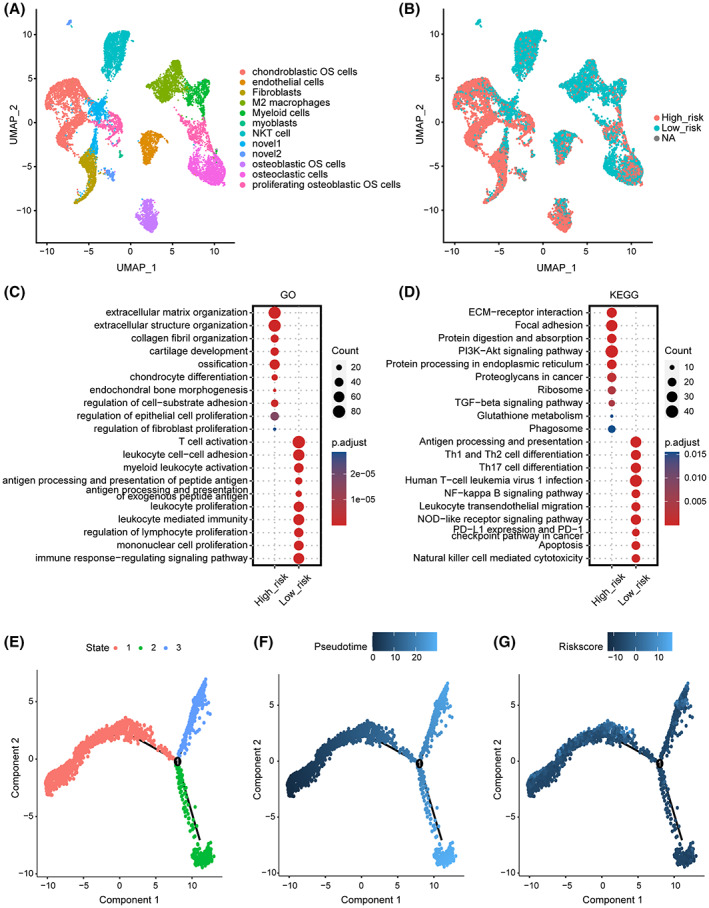
FIGURE 5.

Single‐cell sequencing investigating the correlation between ERG signature stratification and the tumor microenvironment in OS. (A) UMAP visualization for 12‐cell annotation in OS single‐cell sequencing. (B) All cells were clustered into high‐ and low‐ERG‐score groups by ERG signature. NA represents that partial signature gene expression was not detected in the single‐cell sparse matrix. (C) GO enrichment analysis based on marker genes of two ERG score groups. (D) KEGG enrichment analyses based on marker genes of two ERG score groups. Color represents the adjust.p value, the darker the red, the higher the significance; the darker the blue, the lower the significance. (E) Pseudotime trajectory analysis divided OS cells into three different cell states. (F) Pseudotime pattern based on the pseudotime trajectory analysis on OS cells. (G) The ERG score distribution of OS cells on pseudotime trajectory analysis.
