
FIGURE 7.
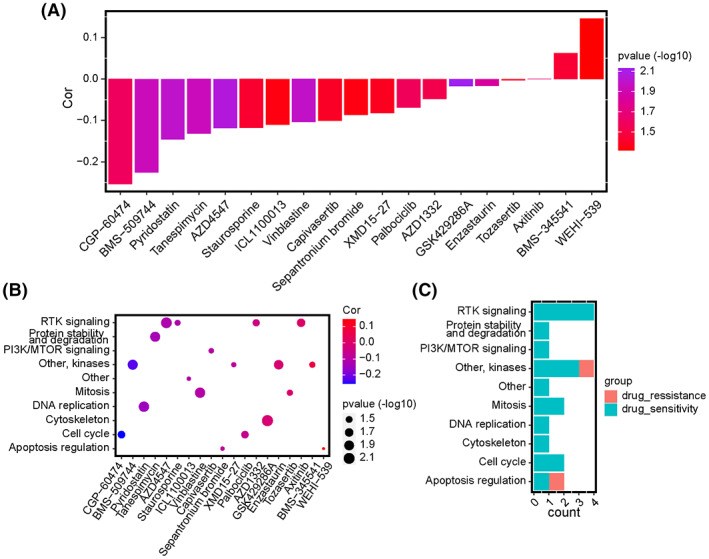
Correlations between the ERG signature and drug responses in GSDC pan‐cancer cell lines. (A) Bar diagram of the correlation between ERG score and IC50 of anticancer drugs in pan‐cancer. Altitude represents the correlation, the higher the altitude, the greater the correlation. Color represents statistical significance (p‐value). The more purple the color, the greater the significance. (B) Scatter diagram of the correlation between IC50 of anticancer drugs and targeting signaling pathways. The size of the plots represents statistical significance (p‐value). Red represents a positive correlation, and blue represents a negative correlation. (C) The bar diagram exhibits the numbers of sensitive and resistant drugs regarding the targeting pathways.