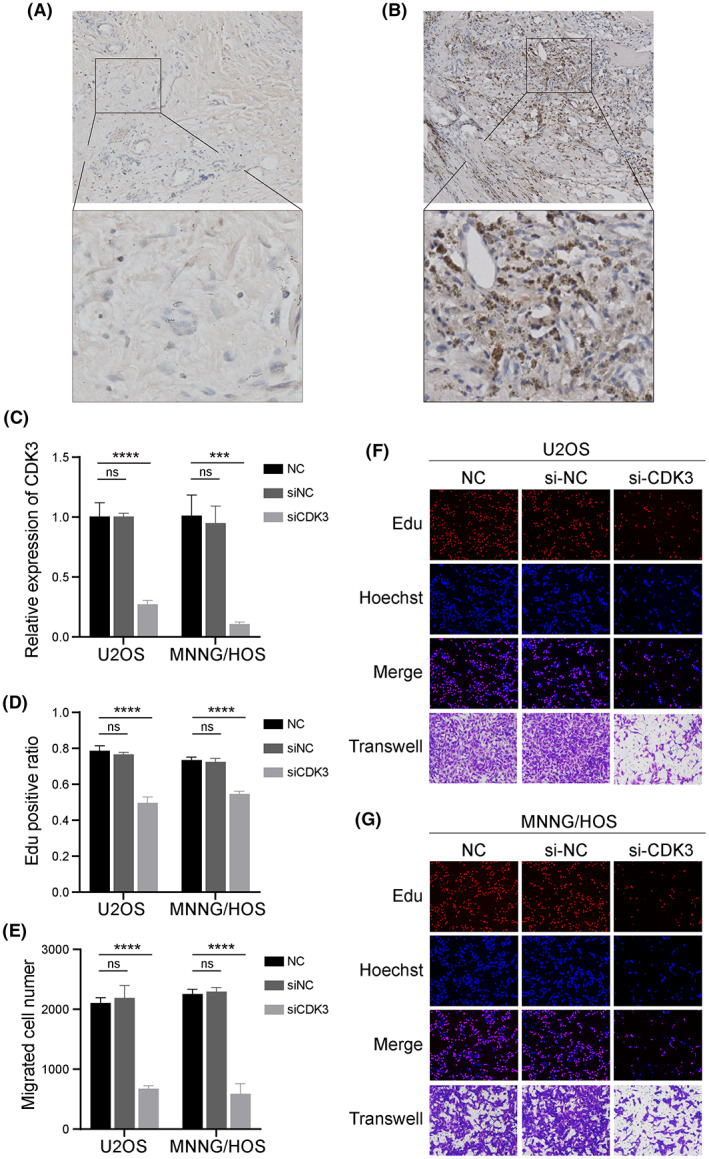
FIGURE 8.

In vitro validation on CDK3. Representative immunohistochemical images of expressions of CDK3 in para‐carcinoma (A) and OS (B) tissues. (C) The relative expression level of CDK3 in normal control, siNC, and siCDK3 groups in U2OS and MNNG/HOS. (D) EdU‐positive ratios were calculated (n = 3) in normal control, siNC, and siCDK3 groups in U2OS and MNNG/HOS. (E) Migration cell numbers (n = 3) were counted after si‐RNA transfection. Representative images of EdU (red), Hoechst staining (blue), and transwell (purple) results in normal control, siNC, and siCDK3 groups in U2OS (F) and MNNG/HOS (G). Ordinary one‐way ANOVA test ***p < 0.001; ****p < 0.0001; ns, no significance.
