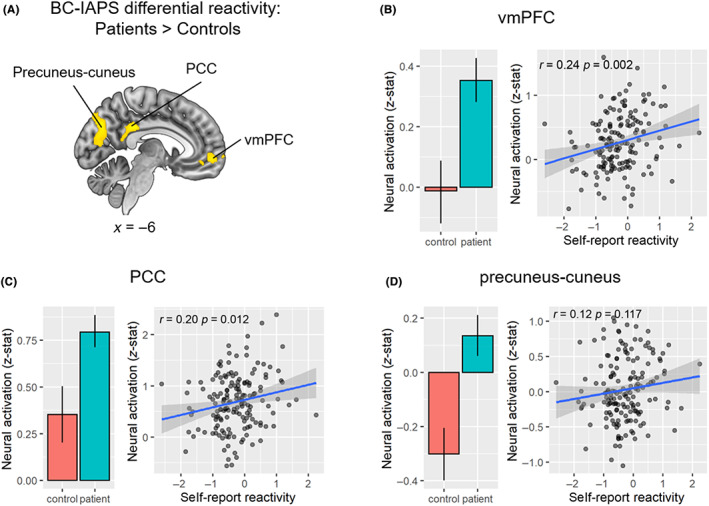
FIGURE 3.

Group comparison between BC patients and controls in the neural BC‐IAPS differential reactivity. (A) Group comparison map of BC patients > controls. Yellow regions indicate where BC patients had greater activation for the BC‐IAPS differential reactivity than controls. (B) Neural activation (z‐stat) for BC‐IAPS reactivity in the vmPFC cluster between the control and patient groups (left) and its correlation with self‐report BC‐IAPS differential reactivity. (C) Neural activation (z‐stat) for BC‐IAPS reactivity in the PCC cluster between the control and patient groups (left) and its correlation with self‐report BC‐IAPS differential reactivity (right). (D) Neural activation (z‐stat) for BC‐IAPS reactivity in the precuneus‐cuneus cluster between the control and patient groups (left) and its correlation with self‐report BC‐IAPS differential reactivity (right). PCC, posterior cingulate cortex; Prec, precuneus; vmPFC, ventromedial prefrontal cortex. MNI coordinates in mm. Error bar: 95% confidence interval.
