
FIGURE 2.
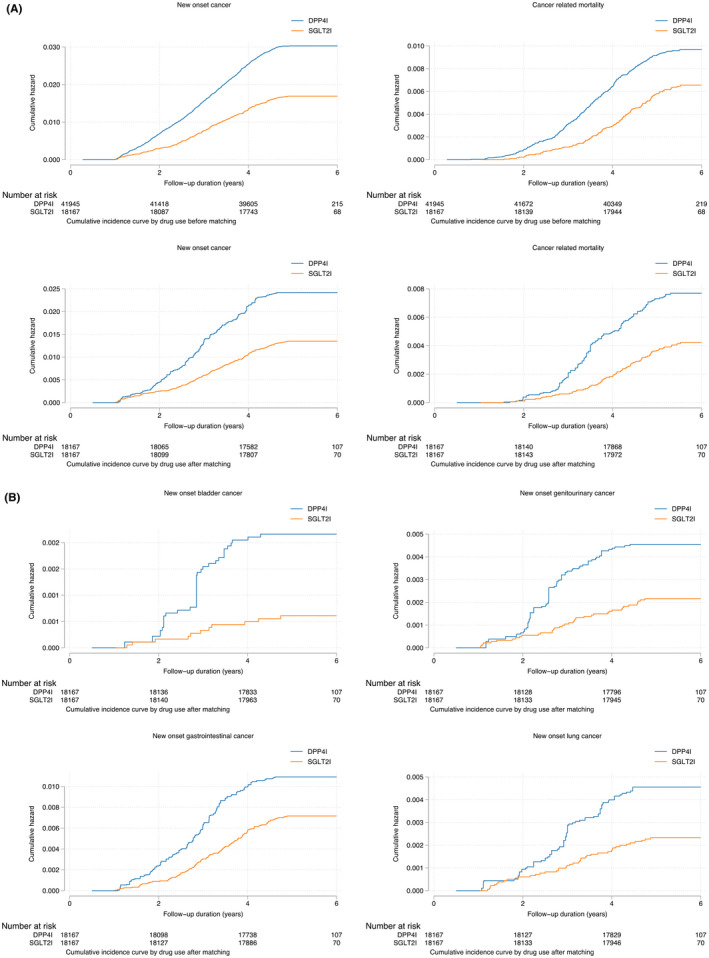
(A) Cumulative incidence curves for new‐onset cancer and cancer‐related mortality stratified by drug exposure effects of SGLT2I and DPP4I before and after propensity score matching (1:1). (B) Cumulative incidence curves for different new‐onset cancer outcomes stratified by drug exposure effects of SGLT2I and DPP4I in the matched cohort.