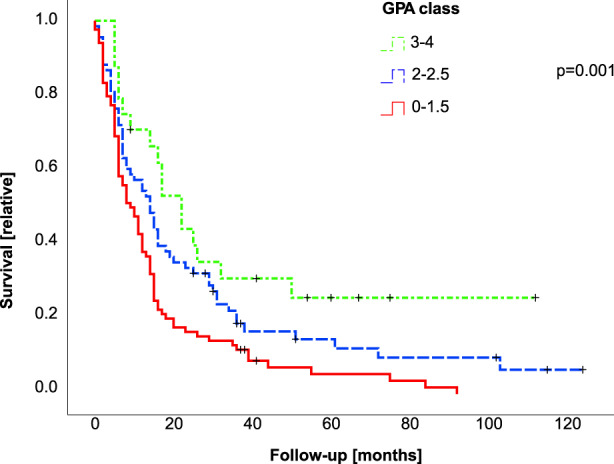
FIGURE 1.

GPA score classes are associated with survival in operated patients with BM. The Kaplan–Meier survival curve shows outcome of patients with different GPA categories. The GPA score was calculated based on patient characteristics at the time of diagnosis. According to score results, patients were assigned to three different GPA categories with a score result of 0–1.5 (red straight line), 2–2.5 (blue dashed line), or 3–4 (green dot‐dashed line). y‐axis marks percentage of surviving patients and x‐axis survival in months. The log‐rank test was employed for comparison of groups, p‐values between groups are shown in brackets.
