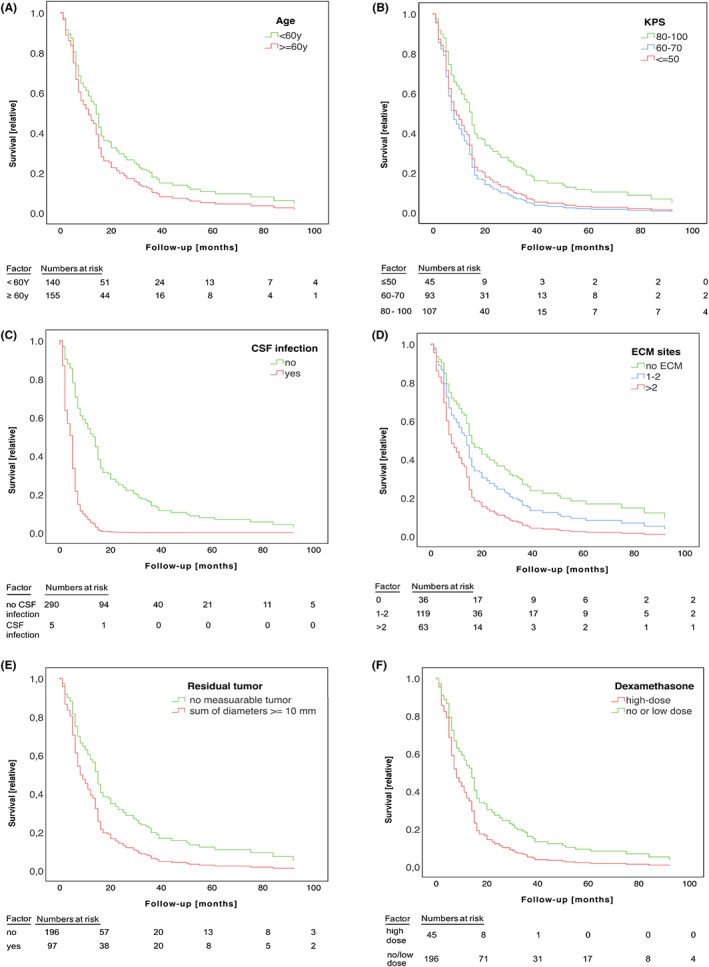
FIGURE 2.

Multivariate assessment of possible surgery‐associated prognostic factors in BM patients. (A–E). Cox hazard curves are shown for candidates for prognostic factors. The percentage of surviving patients is shown on the y‐axis, the x‐axis marks follow‐up in months. A. Survival is shown for individuals of 60 years of age or above (red line) and patients younger than 60 years (green line), in (B) for individuals with a KPS of 80%–100% (green line), 60%–70% (blue line), and 50% or lower (red line), in (C) survival is shown for patients with (red line) or without (green line) CSF infection. In (D), survival is shown for patients with no (green line), one, or two (blue line) or more than two (red line) extracranial metastatic sites. (E) Survival data for patients with gross total tumor resection (green line) or measurable residual tumor (red line), (F) shows outcome of patients with higher dose dexamethasone (≥4 mg within 4 weeks after surgery, red line) compared to no or lower dose dexamethasone <4 mg, green line).
