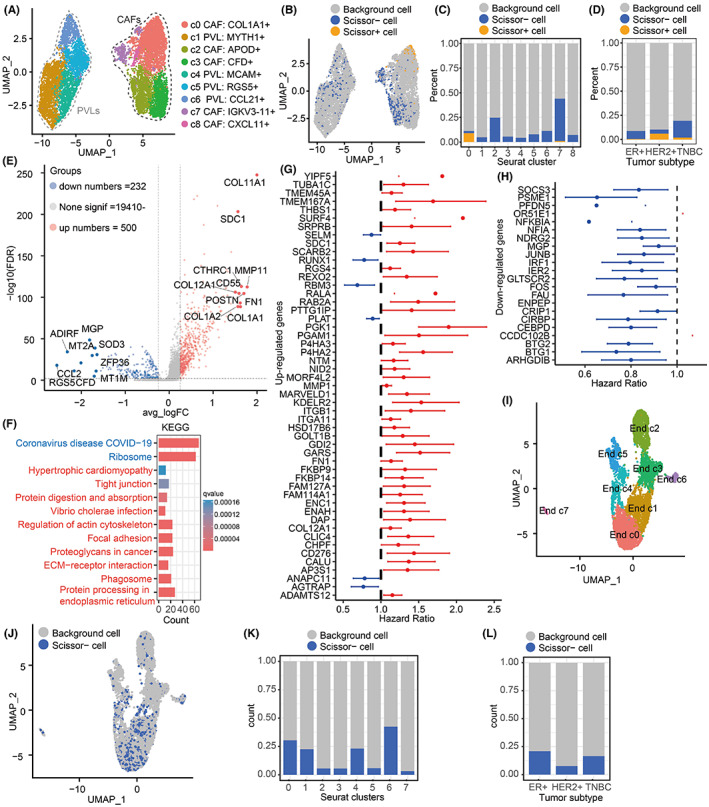
FIGURE 5.

Scissor+/Scissor− prognostic cells in the stromal microenvironment. (A) UMAP shows mesenchymal cell subsets. (B) Identification of prognostic Scissor+/− mesenchymal cells. (C) The proportion of Scissor+/− cells in different mesenchymal cell subsets. (D) Proportion of Scissor+/− cells in ER+, HER2+, and TNBC subtypes. (E) Volcano diagram showing the DEGs between Scissor+ mesenchymal cells and the remaining cells. (F) KEGG enrichment analysis of Scissor+ mesenchymal DEGs. (G) Significantly upregulated prognostic genes in Scissor+ mesenchymal cells. (H) Significantly downregulated prognostic genes in Scissor+ mesenchymal cells. (I) UMAP displays endothelial cell subsets. (J) Identification of prognostic Scissor+/− endothelial cells. (K) Proportion of scissor− endothelial cells in different endothelial cell subsets. (L) Proportion of scissor− endothelial cells in ER+, HER2+, and TNBC subtypes.
