
FIGURE 6.
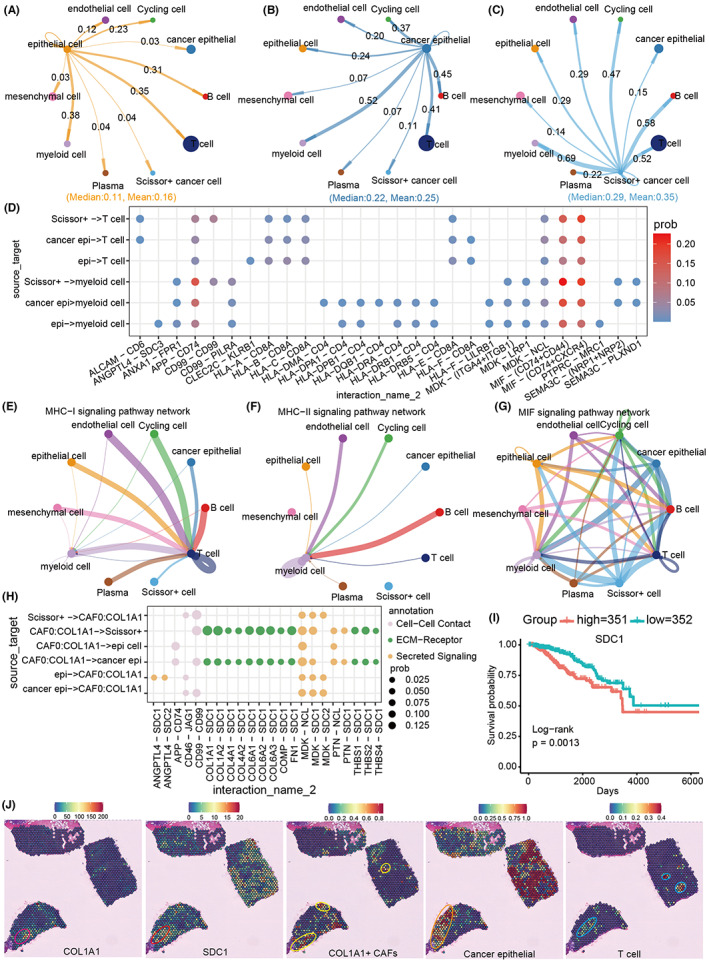
Cell‐to‐cell communication between breast cancer prognostic cells. (A–C) Cell communication frequency of normal epithelial cells, tumor cells, and Scissor+ tumor cells. (D) Significantly altered ligand and receptor pairs between epithelial and immune cells. (E–G) Distribution of cell communication networks mediated by MHC‐I, MHC‐II, and MIF signaling pathways in different cell types. The line color represents different cell–cell interactions, and the line thickness represents the frequency of cell–cell interactions. The thicker the line, the stronger the cell–cell interaction, and the thinner the line, the weaker the cell–cell interaction. (H) Ligand and receptor pairs that mediate specific interactions between COL1A1+ CAFs and epithelial cells. (I) Survival rate of breast cancer patients in high and low SDC1 expression group. (J) Spatial distribution of COL1A1, SDC1 gene and COL1A1+ CAFs, cancer cells and T cells in TNBC breast cancer tissues. Each spot in the figure records specific spatial location information, and each spot may contain from one to a dozen cells. The color of each spot represents the amount of gene expression in it or the predictive percentage score for each cell type. The locations marked by circles are areas of spatial co‐localization.