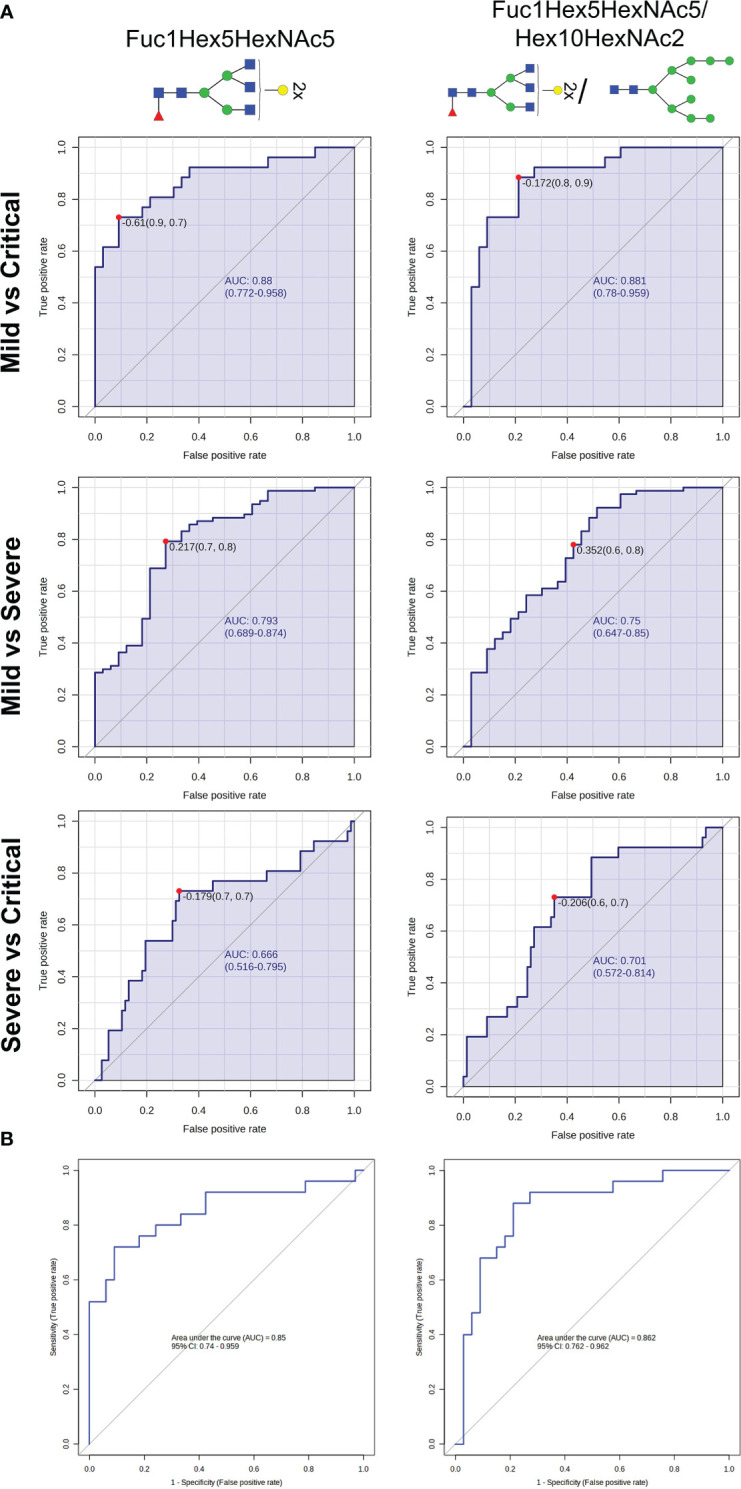
Figure 3.

N-glycan biomarkers to indicate COVID-19 severity at diagnosis. (A) Receiver operating characteristic (ROC) curves analyses of Fuc1Hex5HexNAc5 and Fuc1Hex5HexNAc5/Hex10HexNAc2 for distinguishing COVID-19 patients between groups of severity. (B) Binary logistic regression modelling analysis testing the accuracy of Fuc1Hex5HexNAc5 and Fuc1Hex5HexNAc5/Hex10HexNAc2 to differentiate mild from critically ill patients with COVID-19 in a randomly selected set of patients. For the N-glycan cartoons, green circles denote mannose, yellow circles denote galactose, blue squares denote N-acetylglucosamine, red triangles denote fucose, and purple diamonds denote N-acetylneuraminic acid.
