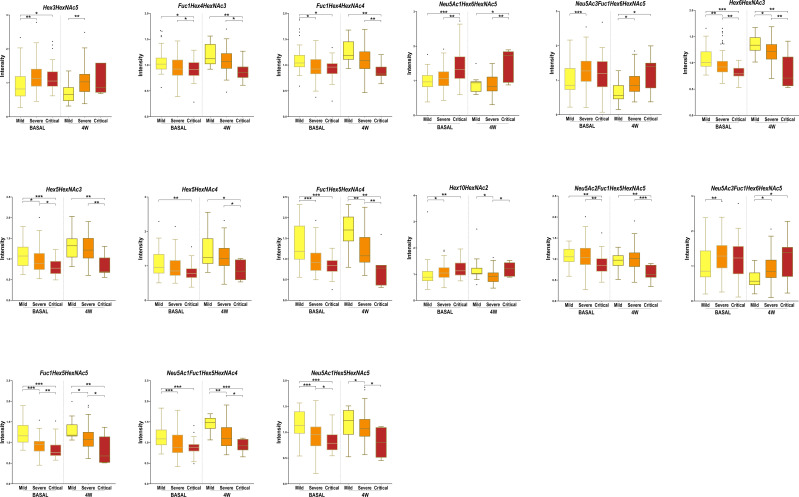
Figure 4.
Box-and-whisker plots showing N-glycan abundance levels in COVID-19 patients. Relative abundance of total plasma N-glycans in different COVID-19 severities (mild, severe and critical) at diagnosis (BASAL) and at 4 weeks postdiagnosis (4W). Kruskal-Wallis, *p-value < 0.05; **p-value < 0.01 ***p-value < 0.001.

