
Figure 1.
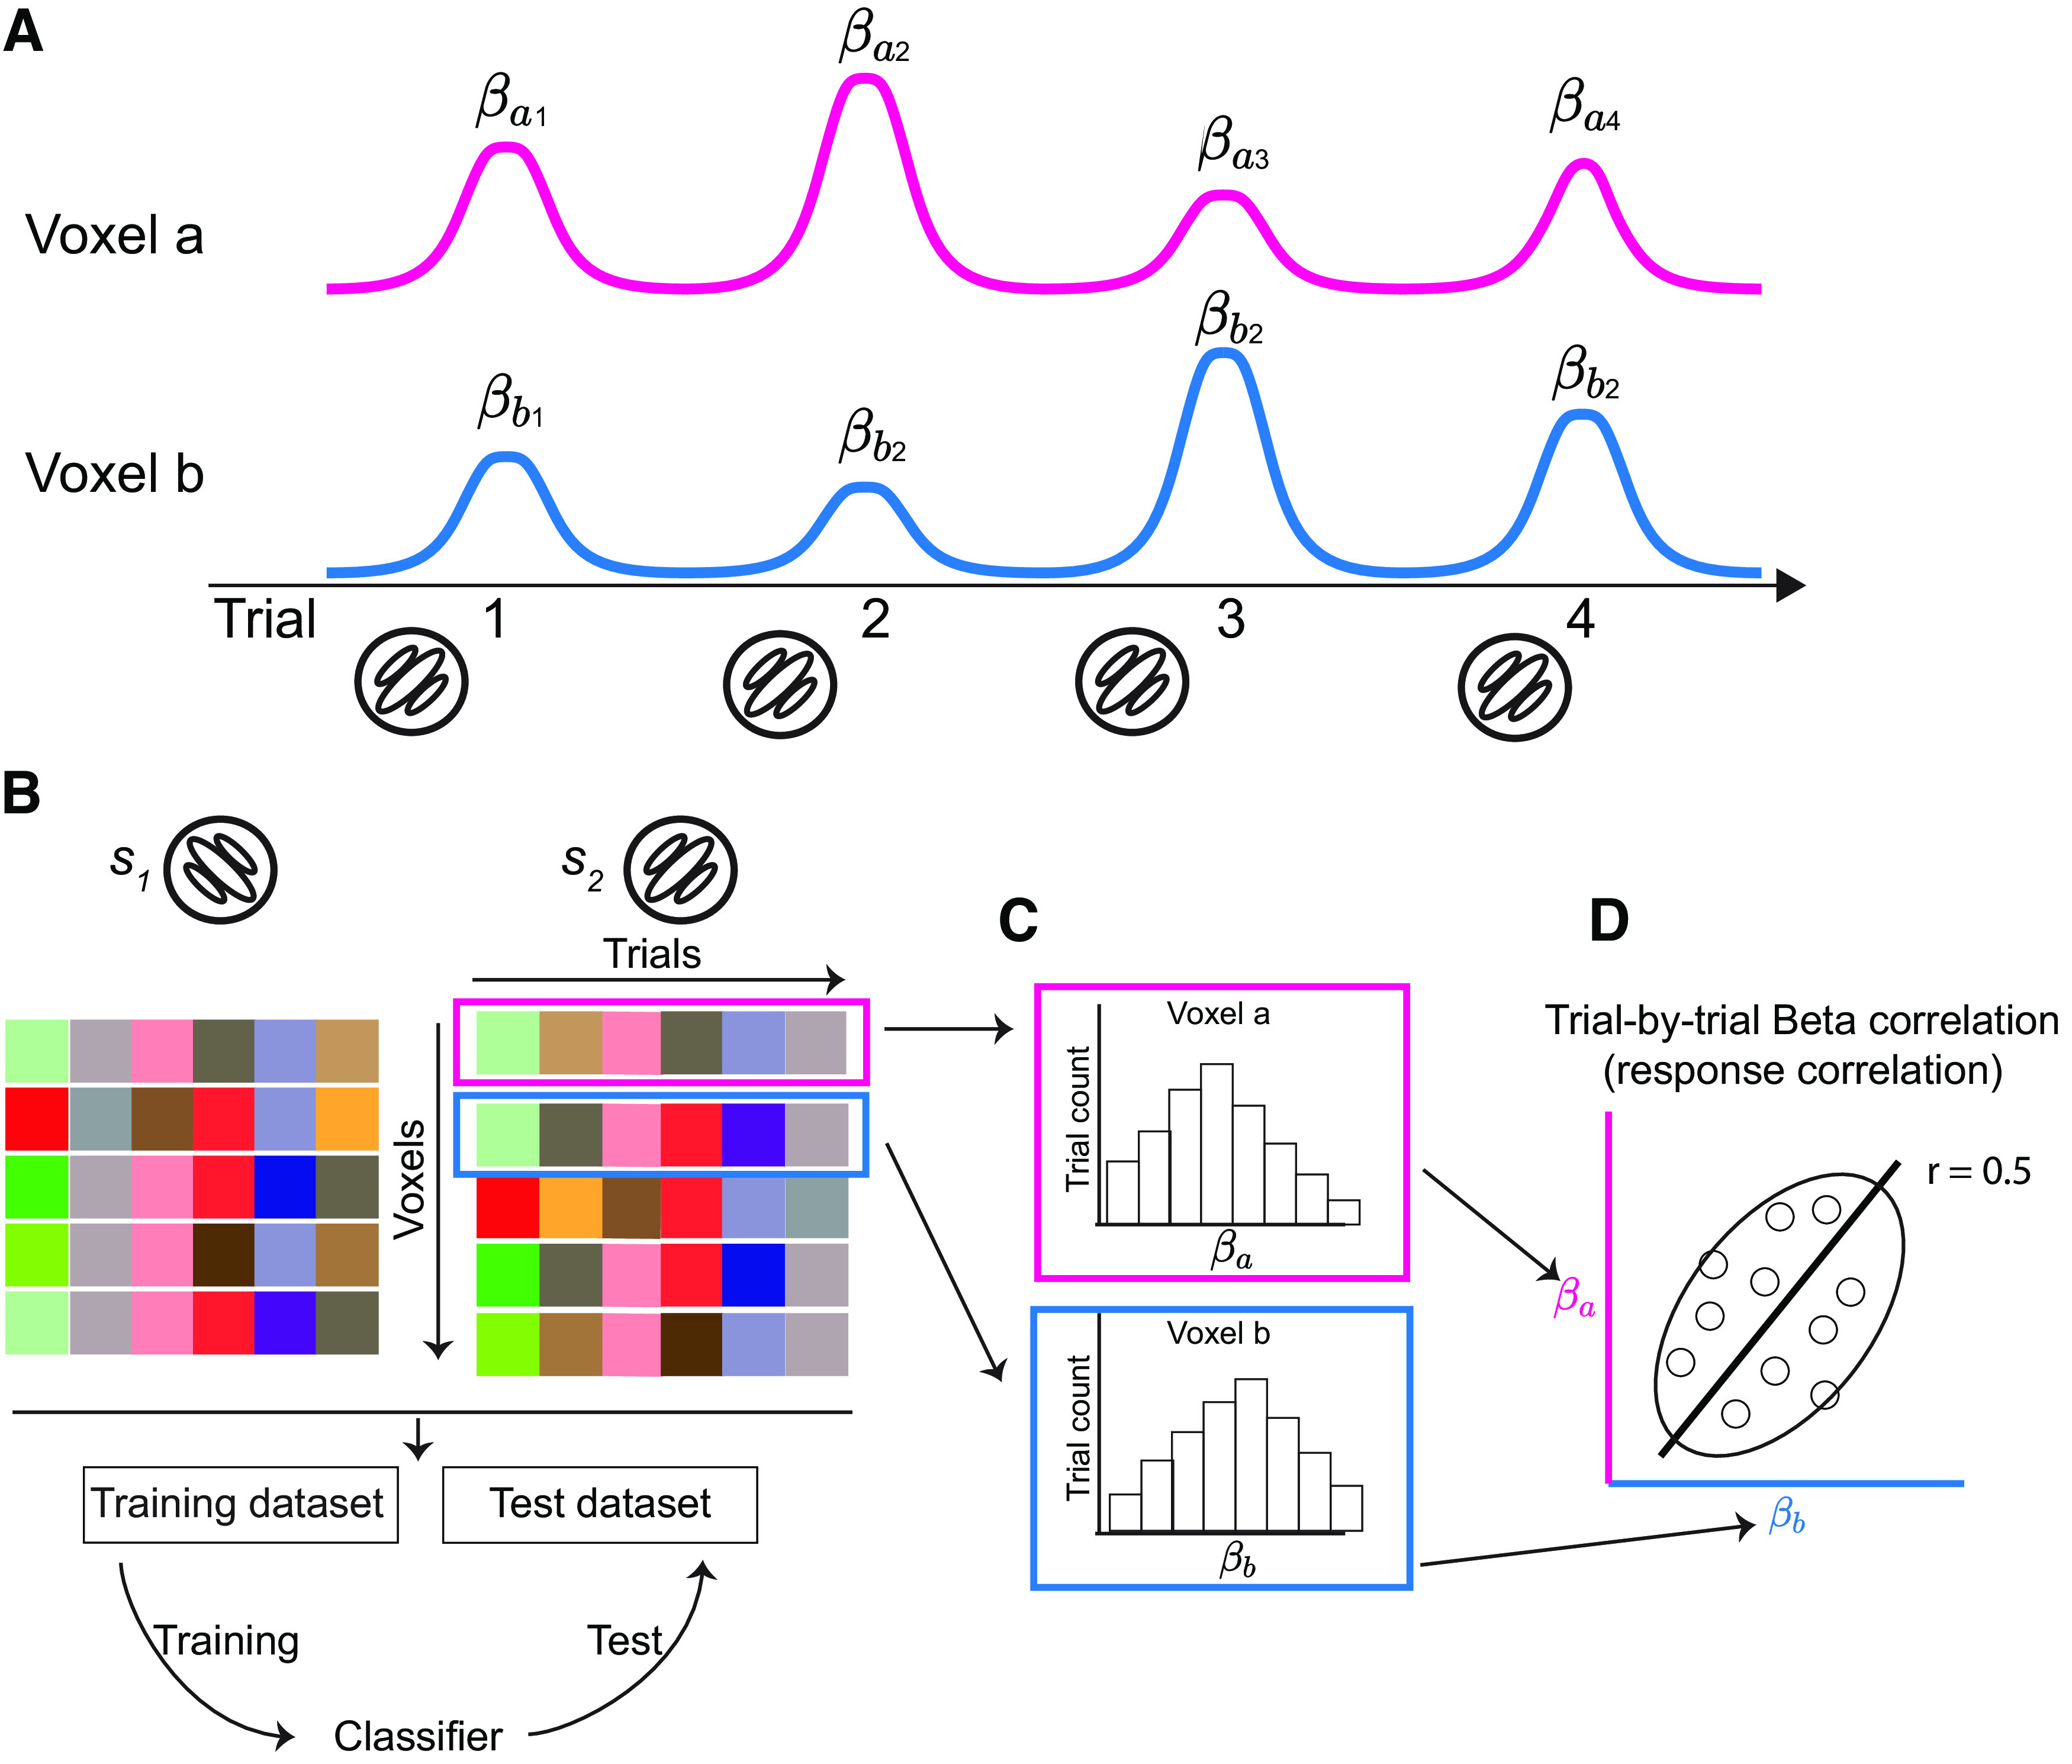
Trial-by-trial response correlation in multivariate fMRI data. A, Estimations of single-trial voxel responses. Magenta and blue lines represent the time series of voxels a and b across four trials of the same grating stimulus. For MVPA, the stimulus in each trial is modeled as a single predictor in general linear modeling to estimate single-trial voxel activity (i.e., beta weight). and indicate the response of voxels a and b, respectively, in the ith trial. B, In the problem of binary classification, multivariate voxel responses for each stimulus can be summarized as a voxel-by-trial matrix. Each item in this matrix is the activity of the ith (row) voxel in the jth trial (column). Combining the two data matrices for the two stimuli, a classifier can be trained on a training dataset and then evaluated on a test dataset. C, Responses of a single voxel across trials (i.e., a row in a data matrix in B) is a random variable following some distribution. D, Beta-series correlation shown by the scatter plot of the responses of voxels a and b (i.e., two rows in a data matrix in B). The solid line is the correlation line, the open circles represent the activity of individual trials. The ellipse illustrates the shape of the 2 d response distribution, and the direction of the ellipse depicts a positive response correlation (e.g., r = 0.5 in this example) between the two voxels. We particularly emphasize that between-voxel beta-series correlation is neither resting-state functional connectivity nor task-based functional connectivity calculated by correlating the residual time series after regressing out stimulus-evoked responses from general linear modeling.