
Figure 2.
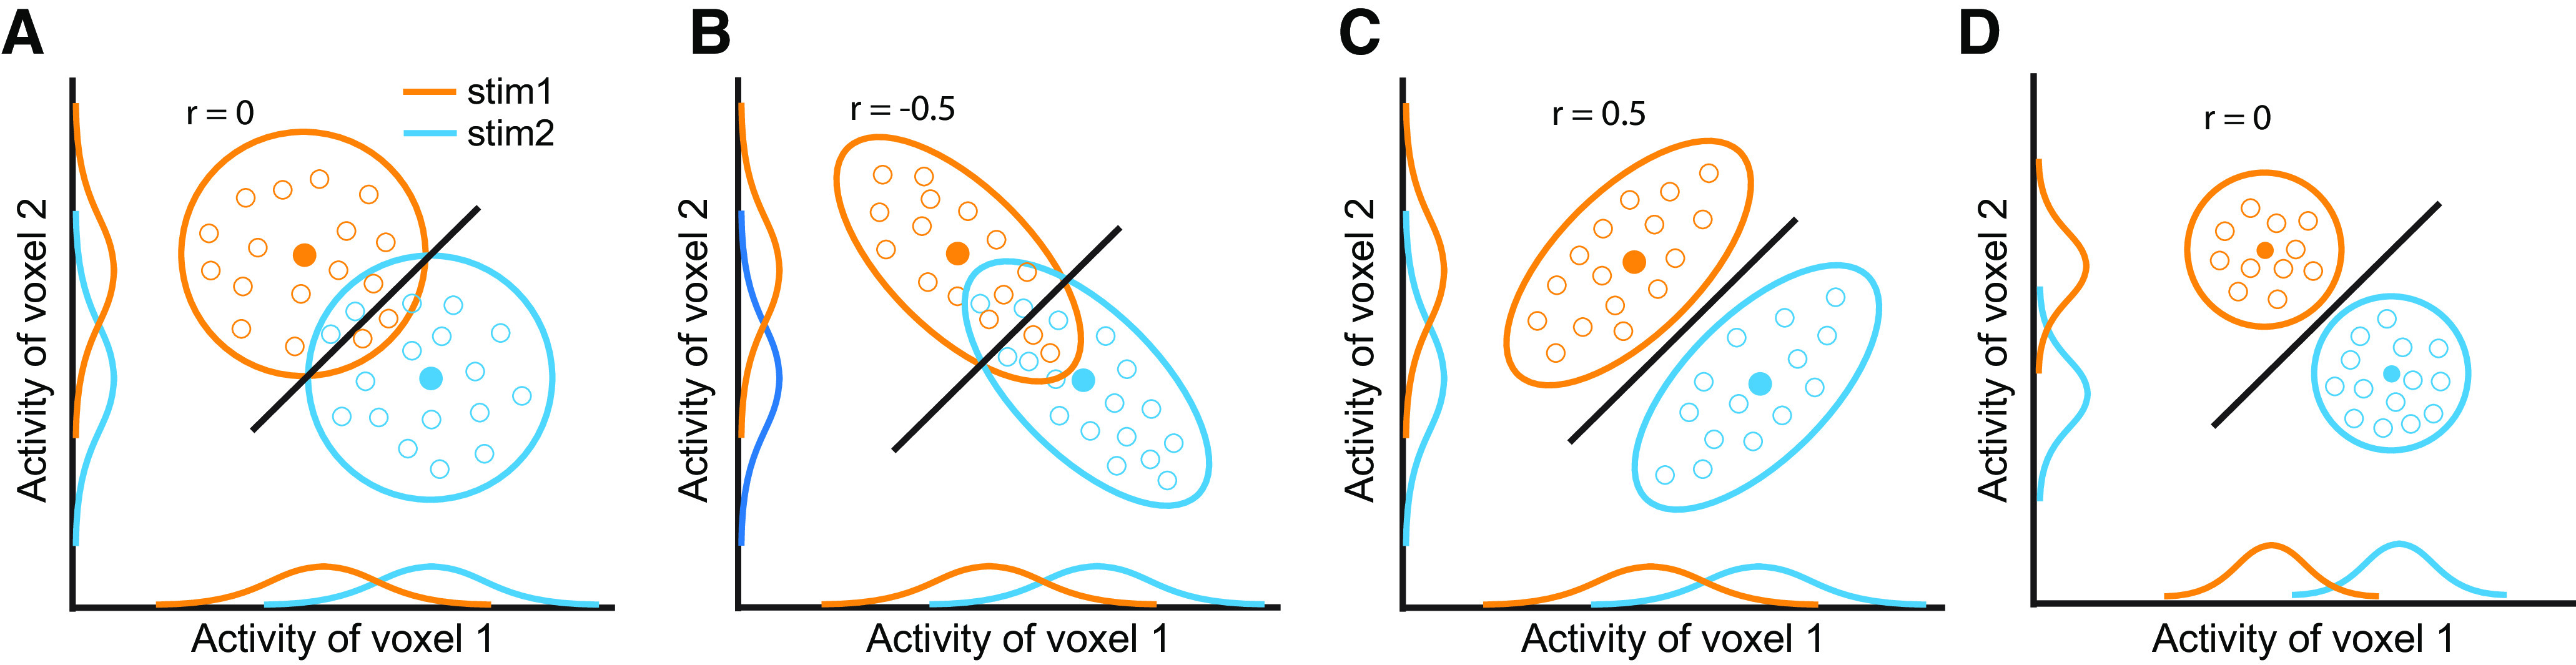
A two-voxel scenario showing the effects of RCs on decoding. The blue and orange circles or ellipses represent 2 d response distributions toward two stimuli. The solid dots represent the mean of the distributions, and the open dots represent individual trials consisting of the distributions. The solid lines are classifiers. The 1 d distributions are the projection of the 2 d distributions on the x-axis and y-axis. In this example, compared with the case of no RCs (e.g., r = 0 in A), negative RCs impair (e.g., r = −0.5 in B) and positive RCs improve (e.g., r = 0.5 in C) decoding accuracy. Note that the example correlation values correspond to the 2 d distributions, not the classifier lines. The amount of stimulus information is directly linked to decoding accuracy. As such, stimulus information in C, D is higher than in A, B. Importantly, the marginal distributions in A–C are identical, but the decoding accuracies are markedly different across the three cases. In D the variance of the two distributions shrinks and consequently induces higher decoding accuracy. C and D demonstrate that identical decoding accuracy can correspond to two distinct underlying representational geometries.