
Figure 3.
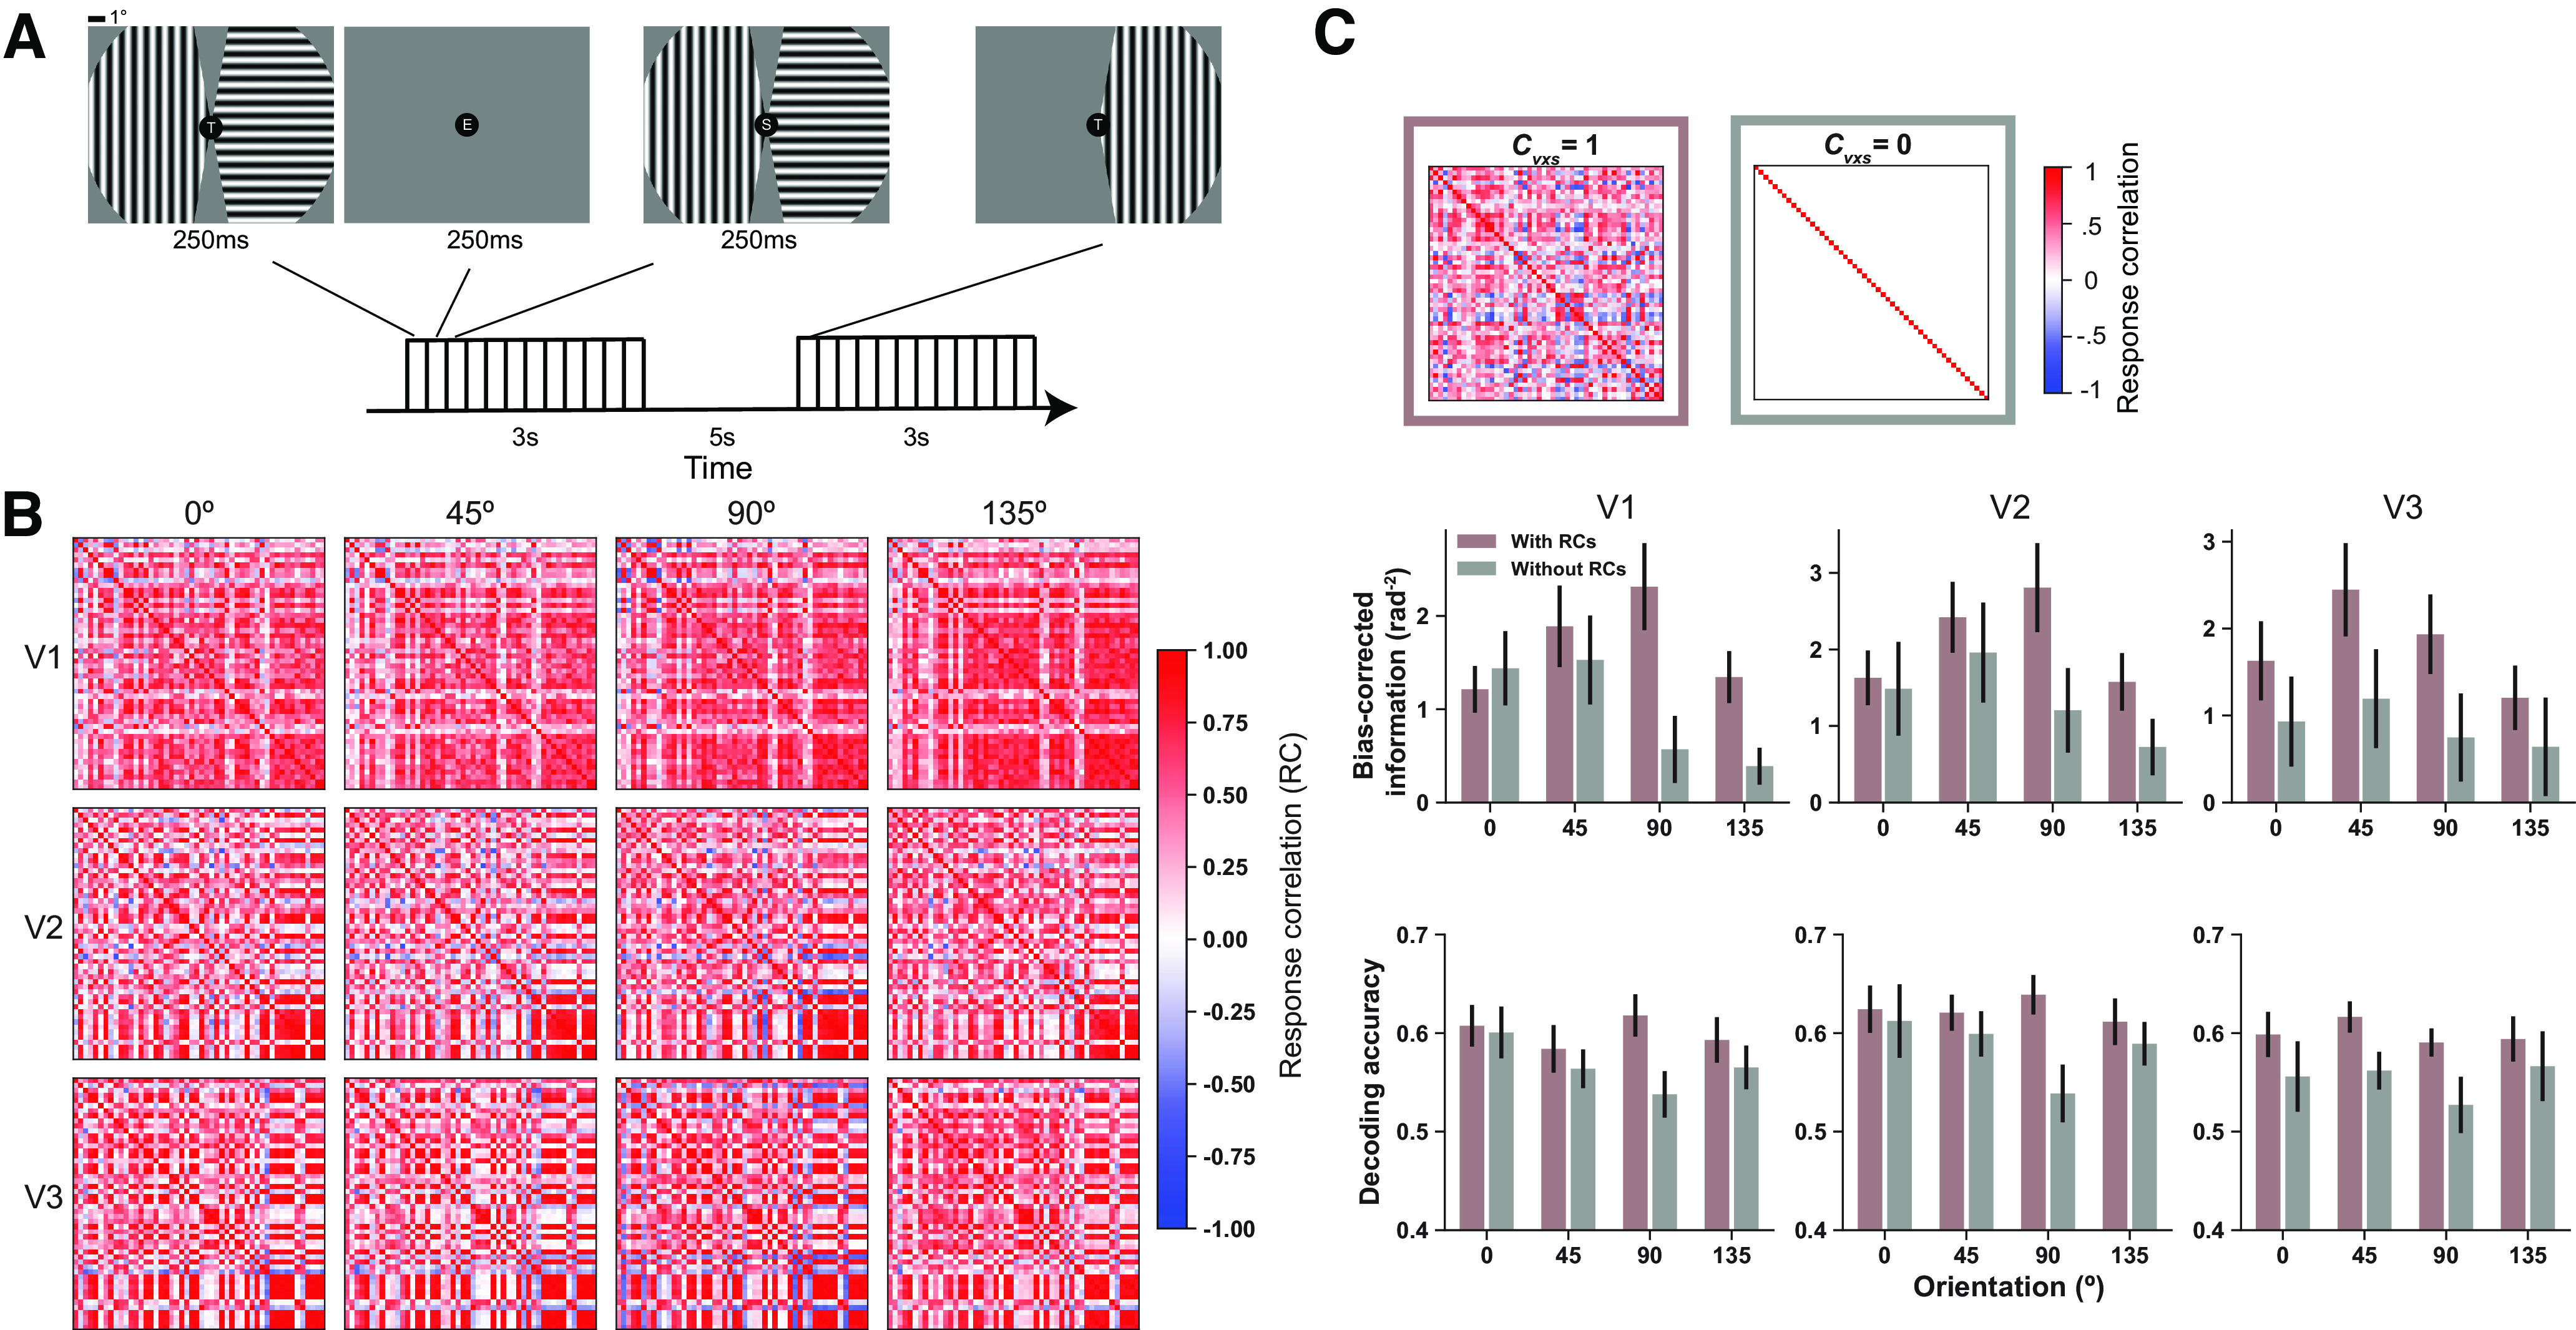
Voxelwise response correlations enhance stimulus information. A, Schematic illustration of example trials in the orientation experiment. Two gratings are presented in each visual field. Their orientations are independently selected from four orientations (0°, 45°, 90°, 135°). In some baseline trials, only one grating is presented. Subjects are asked to attend to and understand the letter stream presented at the fixation point. B, example correlation matrices of V1–V3 in one hemisphere of one subject. These results show that the correlations between the same pool of voxels but across different stimuli are similar. In other words, the noise correlations between voxels are mostly stimulus invariant. C, Left, Matrix is the identity matrix. Right, Matrix is an example response correlation matrix estimated from data. Hypothetical removal of response correlations between voxels (gray bars) reduces the amount of information (middle row) and decoding accuracy (bottom row) compared with the case that all response correlations are preserved (puce bars). Error bars indicate SEM across 12 independent samples (6 subjects × 2 hemispheres). Note that the information here is bias corrected using Equations 4 and 5 (see Materials and Methods).