
Figure 5.
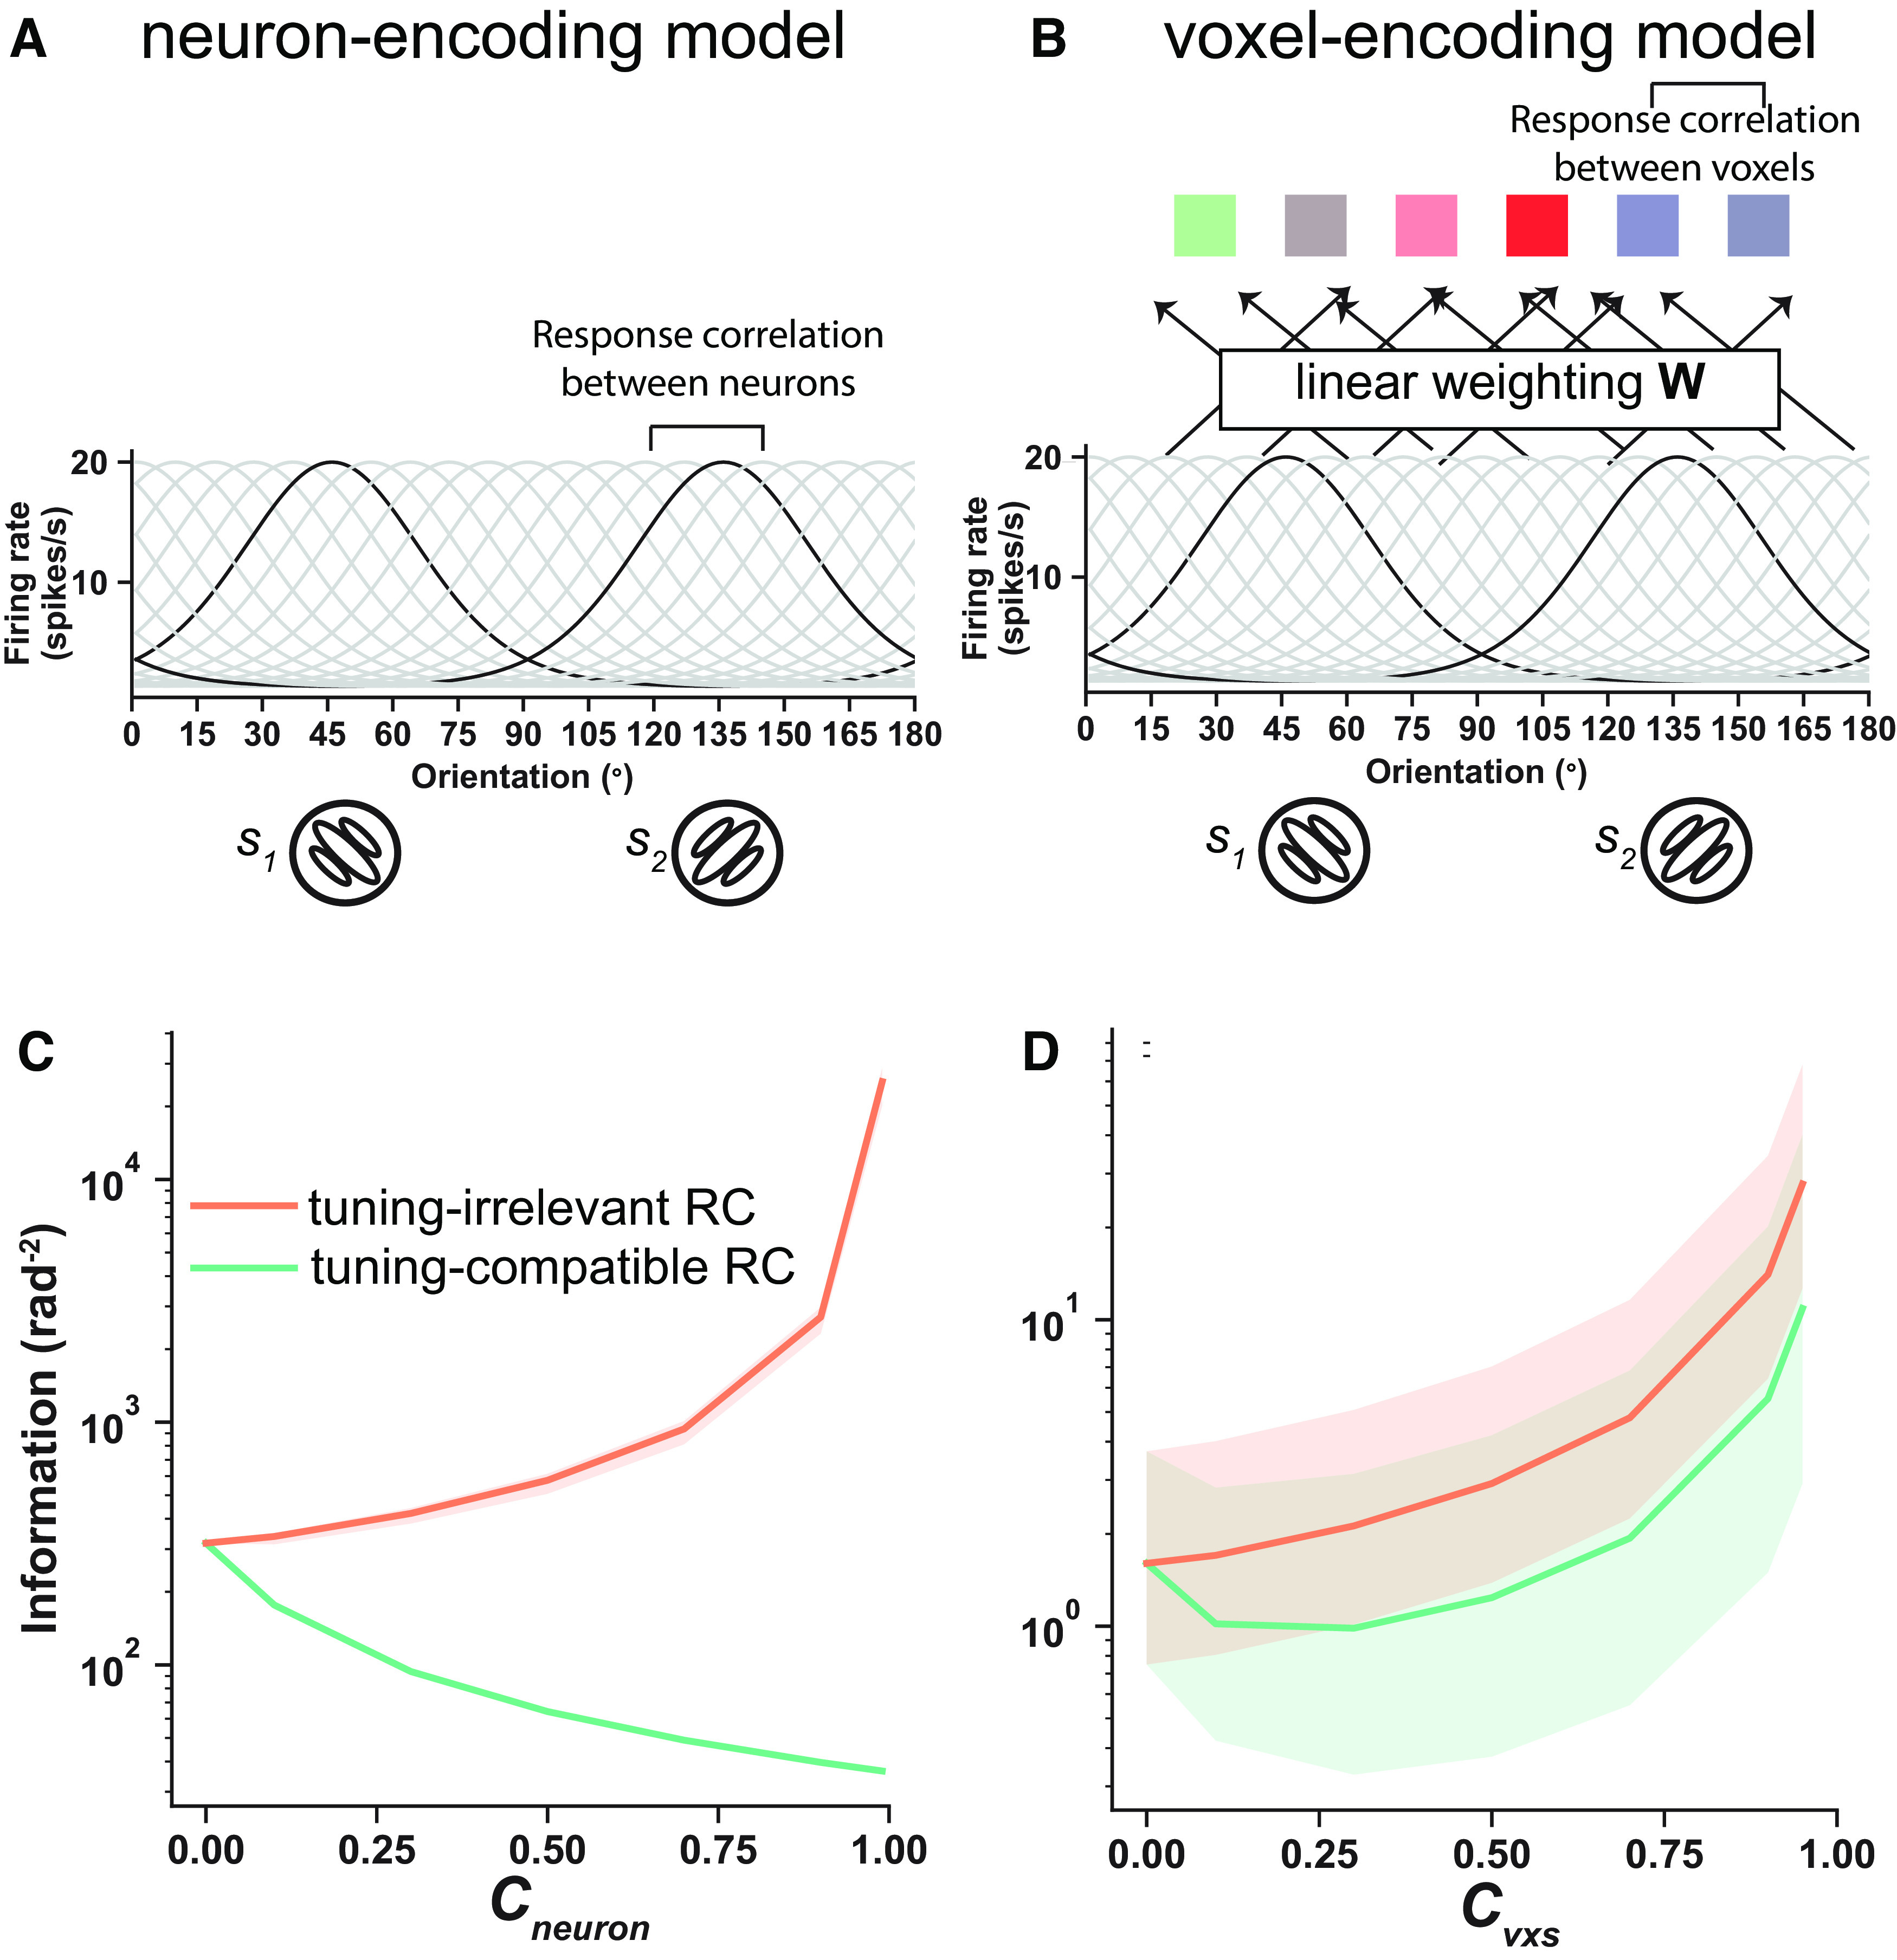
A–D, Neuron- (A) and voxel-encoding (B) models reproduce the effects of RCs reported in the previous neurophysiological literature (C) and our fMRI data (D). and are the RC coefficients controlling the RC strength in the neuron- and the voxel-encoding model, respectively. The shaded areas of the pink curve in C and those of the two curves in D represent the 95% confidence interval for 100 simulations. Note that the green curve in C (i.e., the neuron-encoding model with tuning-compatible RCs) has no variability because neuronal tuning curves and variance are fixed in this condition (see above, Neuron-encoding model).