
Figure 2.
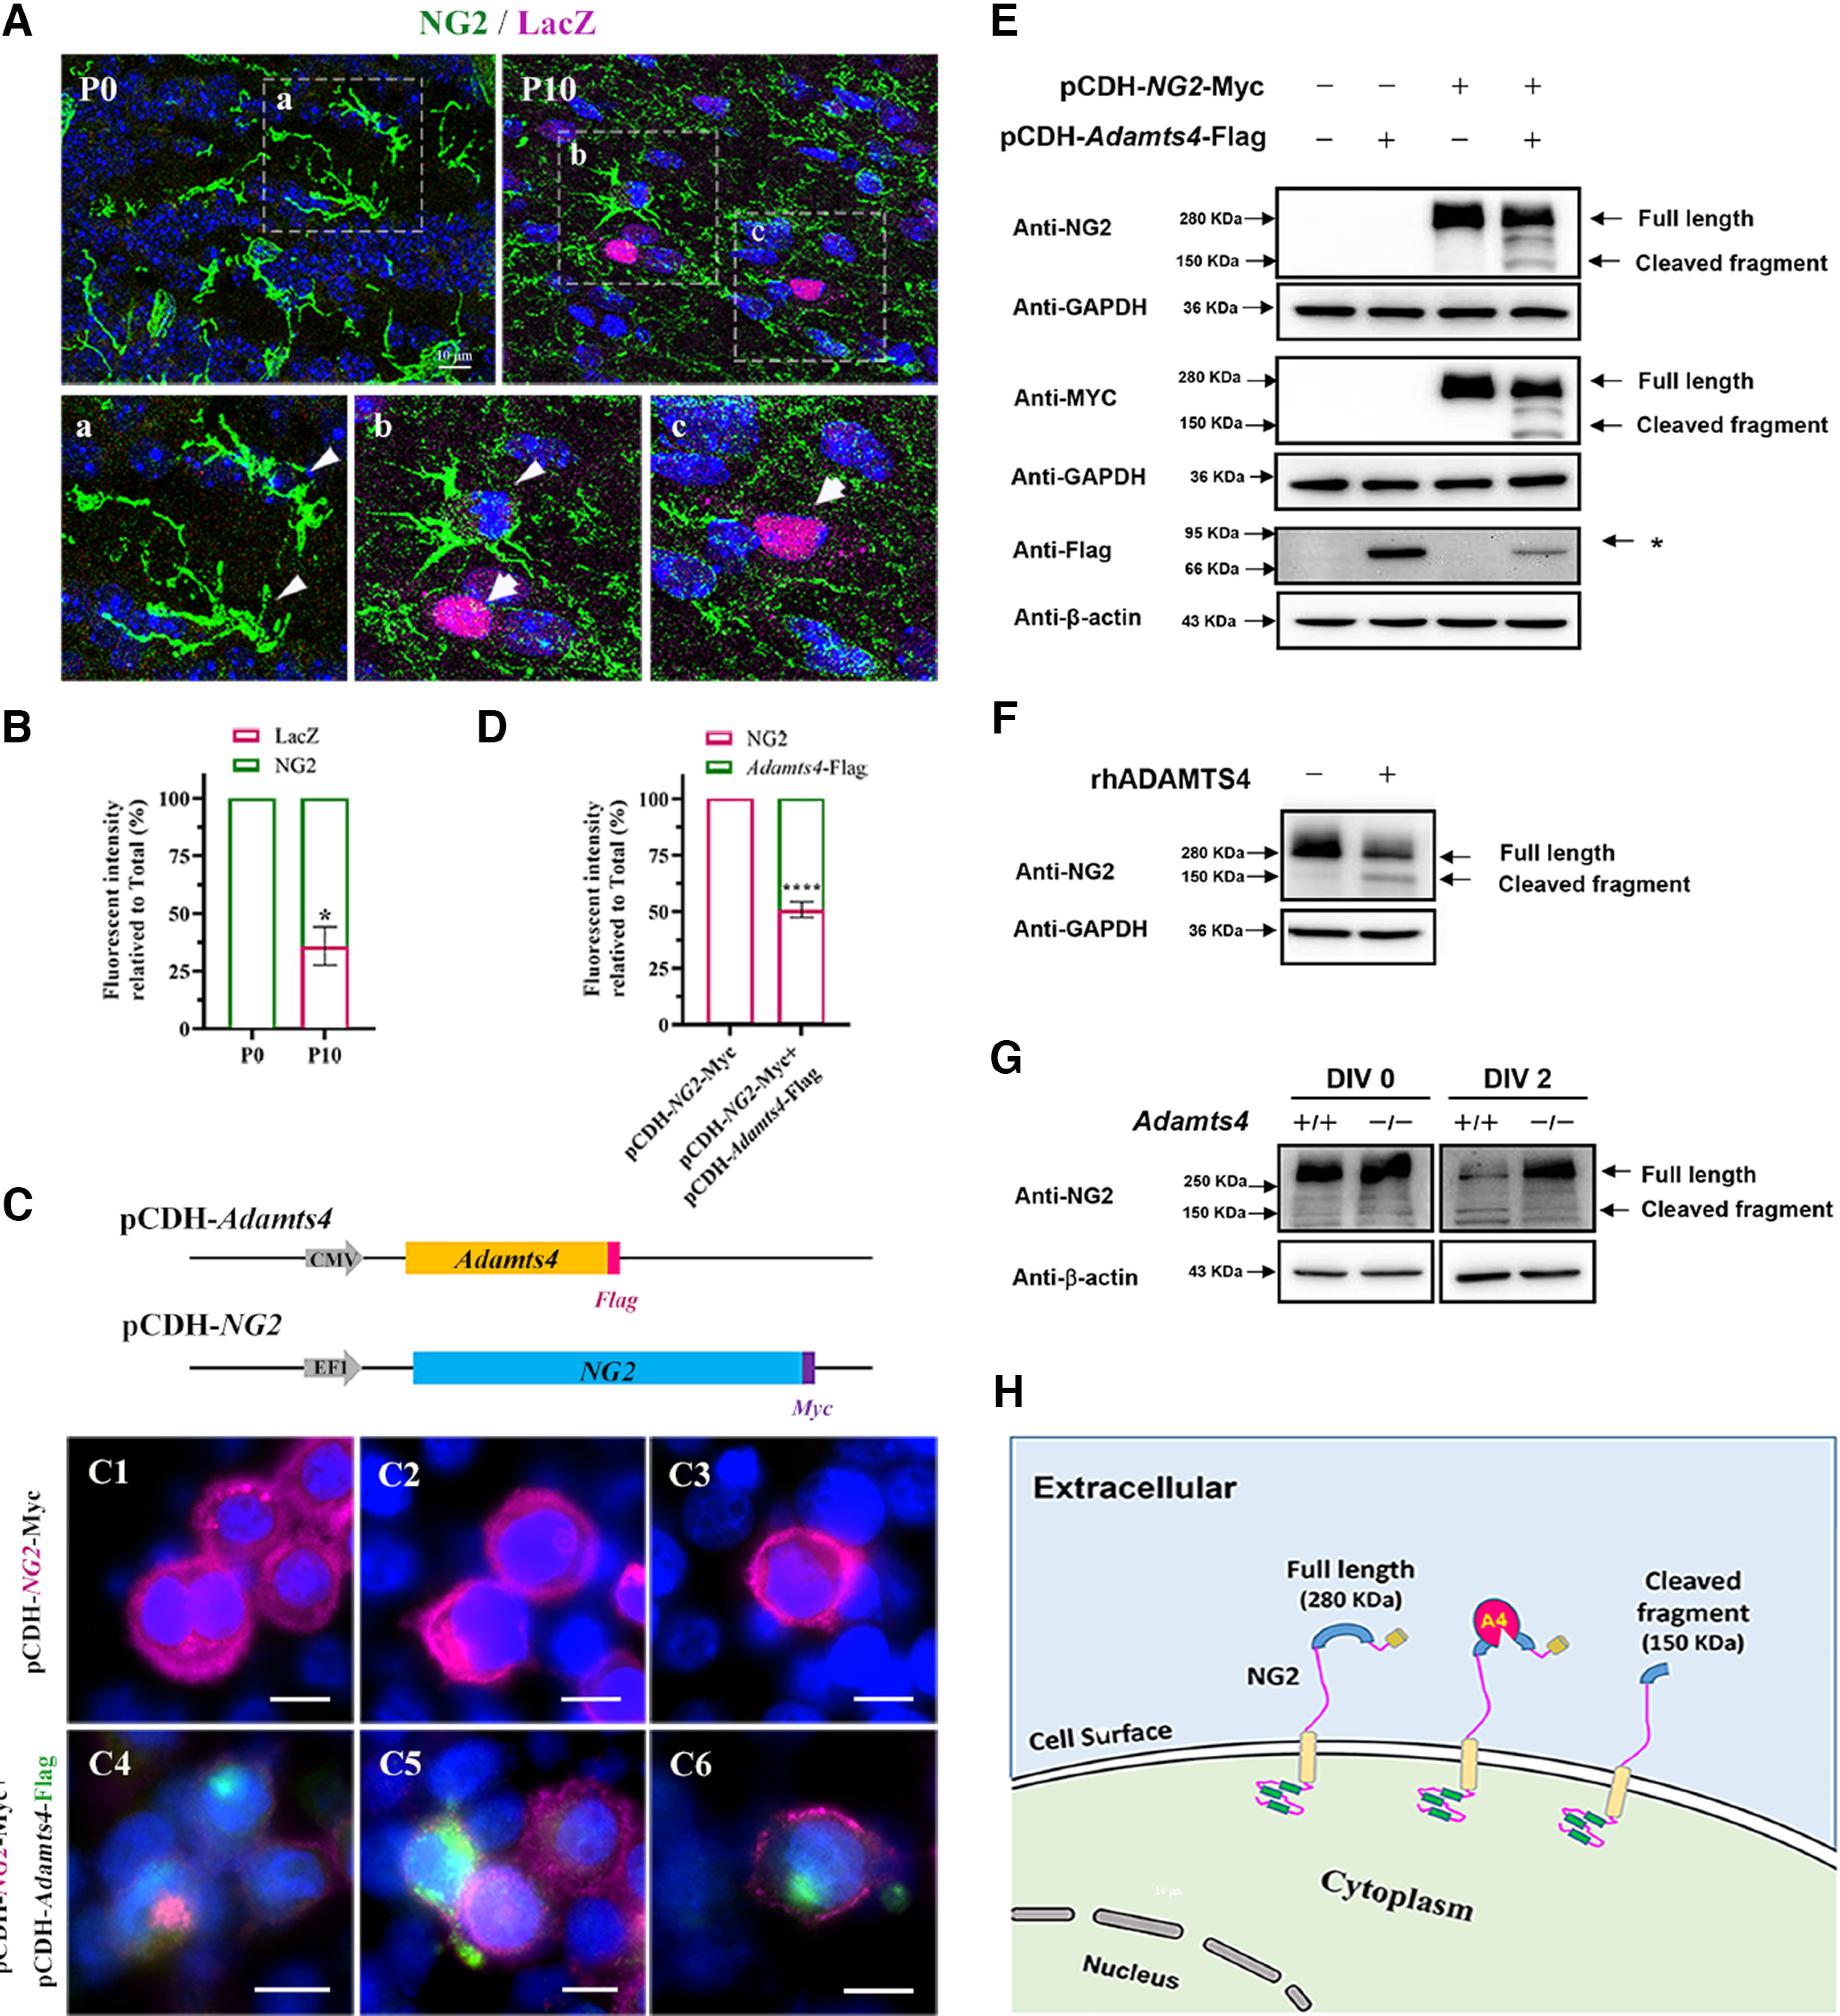
Proteolytic cleavage of NG2 protein by ADAMTS4. Aa–c, Immunofluorescent staining for NG2 (green) and LacZ (magenta) in the corpus callosum of heterozygous mice at P0 and P10. Scale bar, 10 µm. B, Statistical analysis of the fluorescent intensity of LacZ and NG2 per field. At least three representative fields were used from each brain section; n = 3; *p = 0.0122. C, A schematic diagram of the pCDH-Adamts4-Flag and pCDH-NG2-Myc expression constructs. C1–6. Immunofluorescent staining of transfected HEK 293T cells with anti-NG2 (magenta) and anti-Flag (green) antibodies. Cells were transfected with indicated constructs for 48 h. Scale bar, 10 µm. D, Statistical analysis of the fluorescent intensity of LacZ and NG2 per field. At least three fields were randomly acquired from each group; n = 3; ****p < 0.0001. E, Western blot with HEK 293T cells at 48 h after transfection. (* represents the Adamts4-Flag protein. F, Western blotting with primary OPC culture treated with rhADMATS4 proteinase. G, Western immunoblot for detection of NG2 expression in primary culture of OPCs isolated from WT and Adamts4 knockout mice. OPCs were cultured in differentiation medium for 0 and 2 d. H, Schematic illustration of ADAMTS4 cleaving NG2 protein.