
Figure 4.
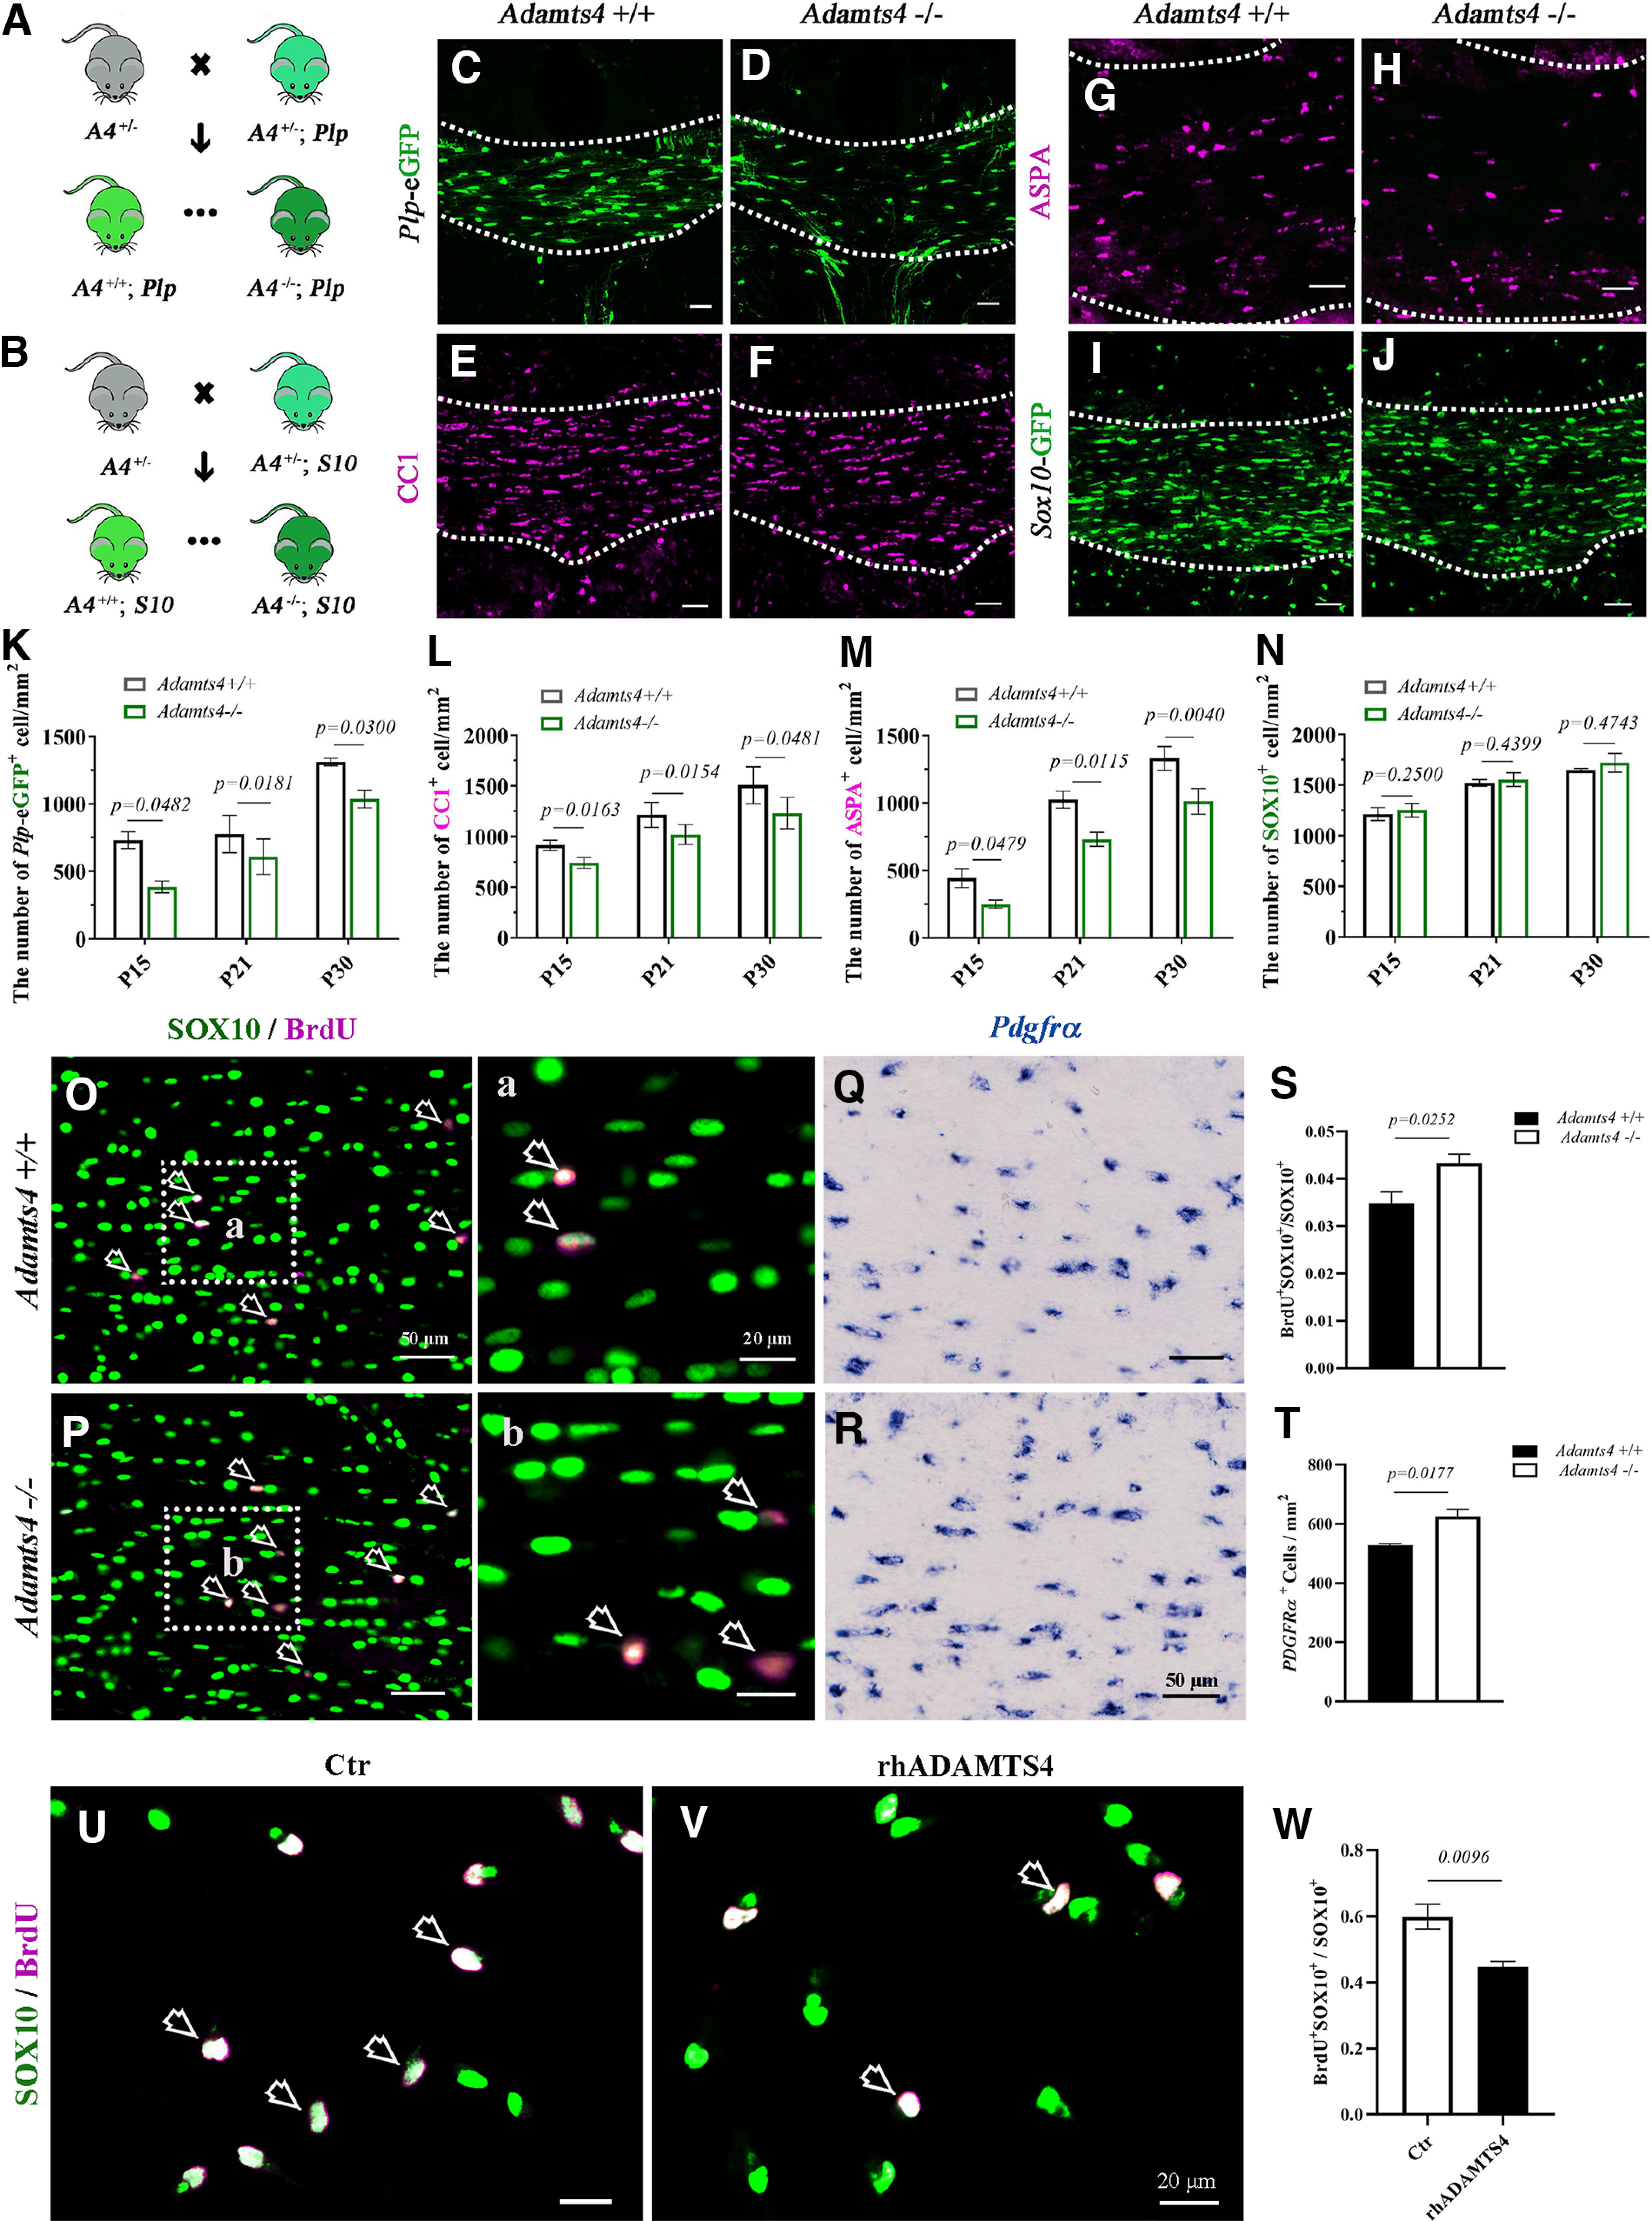
Impaired oligodendrocyte differentiation in Adamts4 mutants. A, B, Strategy for generating of Adamts4 −/−; plp-eGFP mutants (A) and Adamts4 −/−; Sox10-GFP mutants (B). A4, Adamts4; Plp, Plp-eGFP; S10, Sox10-GFP. C, D, The number of Plp-eGFP+ oligodendrocytes decreased in the corpus callosum of Adamts4 null mice. E–H, Immunofluorescent staining of anti-CC1 and anti-ASPA in the corpus callosum of Adamts4 knock-out mice. Scale bar, 50 µm. I, J, Comparable number of Sox10-GFP+ cells in the corpus callosum of WT and Adamts4−/− mice. K–N, Statistical analysis of the number of Plp-eGFP+, CC1+, ASPA+, and Sox10-GFP+ oligodendrocytes per square millimeter in corpus callosum sections; n = 3; p values are shown on the bar graphs. O, Oa, P, Pb, Coimmunofluorescence staining in P15 corpus callosum showed a slight increase of the ratio of BrdU+ dividing cells (magenta) in SOX10+ oligodendrocytes (green) in Adamts4 mutants. Scale bar, 50 µm. Higher-magnification images are shown in a, b. Scale bar, 20 µm. Open arrows, BrdU+ SOX10+ cells. Q, R, In situ RNA hybridization revealed a slight increase of Pdgfrα+ OPCs in P15 corpus callosum of Adamts4 mutants; n = 3. Scale bar, 50 µm. S, Statistical analysis of the number of BrdU+ cells in SOX10+ oligodendrocytes in corpus callosum; n ≥ 3. T, Statistical analysis of the number of Pdgfrα+ cells per square millimeter in corpus callosum; n = 3. U, V, Representative images showing the double immunofluorescent staining with anti-SOX10 (green) and anti-BrdU (magenta) in primary rat OPC culture treated with or without rhADMATS4 (12 nm) proteinase. SOX10+BrdU+ double-positive cells are represented by arrows. Scale bar, 20 µm. W, Statistical analysis of the BrdU+ cells in SOX10+ oligodendrocytes.