
Figure 4.
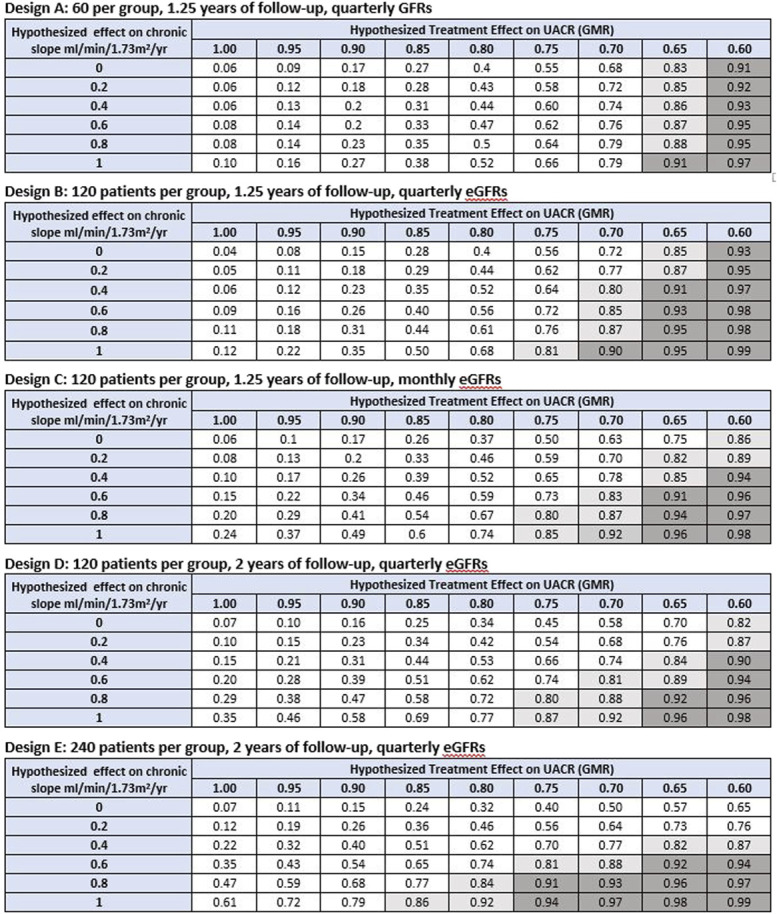
Probability of demonstrating clinical benefit given hypothesized treatment effects on UACR and GFR slope. Clinical benefit defined by a PPVtrial ≥0.85 for inferring a HR <1 for the clinical end point. Shown are the probabilities under alternative Phase 2 designs for obtaining an estimated trial-level positive predictive value (PPVtrial) >0.85 for demonstrating clinical benefit defined as a HR for the clinical end point which is <1 based on combinations of hypothesized true treatment effects on slope and UACR. A total of five Phase 2 designs are considered, with sample size ranging from 60 to 240 patients per group, follow-up time ranging from 1.25 to 2 years, and GFR measurements obtained quarterly or monthly. The probability of demonstrating clinical benefit can be viewed as Type 1 error when the hypothesized treatment effects on both slope and UACR are null (given by the cell in the upper left corner of each table) and as an analog of statistical power relevant to surrogate end points for non-null hypotheses on one or both surrogate end points. The unshaded region designates probabilities of <0.80 for demonstrating a PPVtrial >0.85. The light shaded region indicates probabilities between 0.80 and 0.90 for demonstrating a PPVtrial >0.85. The dark shaded region indicates probabilities ≥0.90 for demonstrating a PPVtrial >0.85. For comparison, under conventional power calculations for testing the null hypotheses that treatment effects on UACR or GFR slope are identical to 0, the minimum detectable treatment effects for UACR are 35.4% under Design A, 26.3% under Designs B-D, and 19.4% under Design E. The minimum detectable treatment effects for GFR slope are 4.73, 3.31, 2.57, 2.23, and 1.57 ml/min per 1.73 m2 per yr, respectively. As noted in the methods section, the minimum detectable effects under conventional power calculations provide information about the smallest effects necessary to demonstrate that effects on UACR or slope differ from 0 but do not indicate whether these nonzero effects are large enough to provide evidence of clinical benefit. GMR, geometric mean ratio; HR, hazard ratio; PPVtrial, trial-level positive predictive value; UACR, urine albumin-to-creatinine ratio. Figure 4 can be viewed in color online at www.jasn.org.