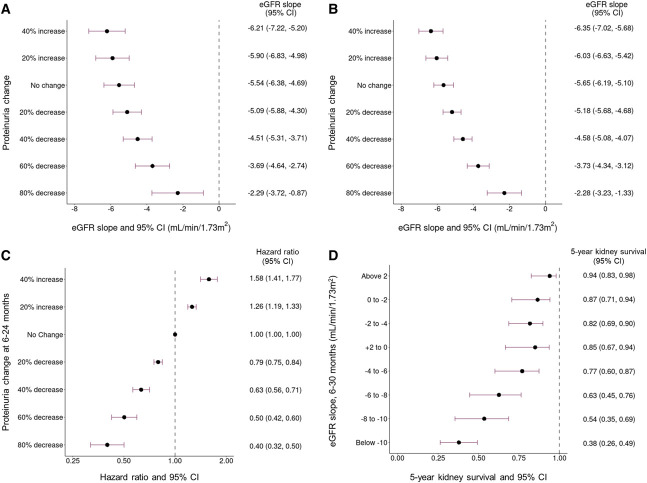
Figure 4.
Forest plots of population 4. (A) Percentage of change in proteinuria at 6–12-month time-averaged proteinuria versus 6–30-month eGFR slope. (B) Percentage of change in proteinuria at 6–24-month time-averaged proteinuria versus total eGFR slope. (C) Percentage of change in proteinuria at 6–24-month time-averaged proteinuria versus hazard ratio of kidney failure/death event. (D) 6–30-month eGFR slope versus 5-year kidney survival rate. CI, confidence interval.

