
Figure 3.
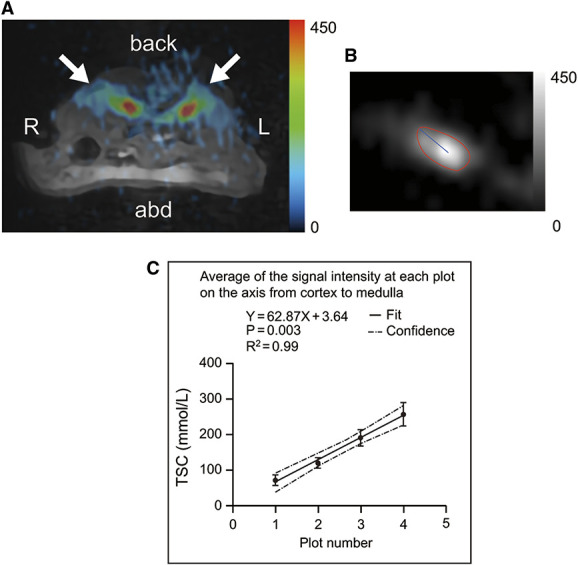
Sodium magnetic resonance imaging of a murine kidney. (A) 23Na MR images merged with 1H MR images (C57BL/6JJcl mice, 6 weeks old, male). This image shows the transverse plane through the abdomen. Arrows indicate the kidneys. (B) 23Na MR image showing the kidney area and the axis from the cortex to the medulla. (C) TSC values at equidistant points along the axis from the cortex to the medulla (C57BL/6JJcl mice, 6 weeks old, male, N=5). 1H, proton; 23Na, sodium; abd, abdomen; L, left; MR, magnetic resonance; R, right; TSC, tissue sodium concentration.