Figure 4.

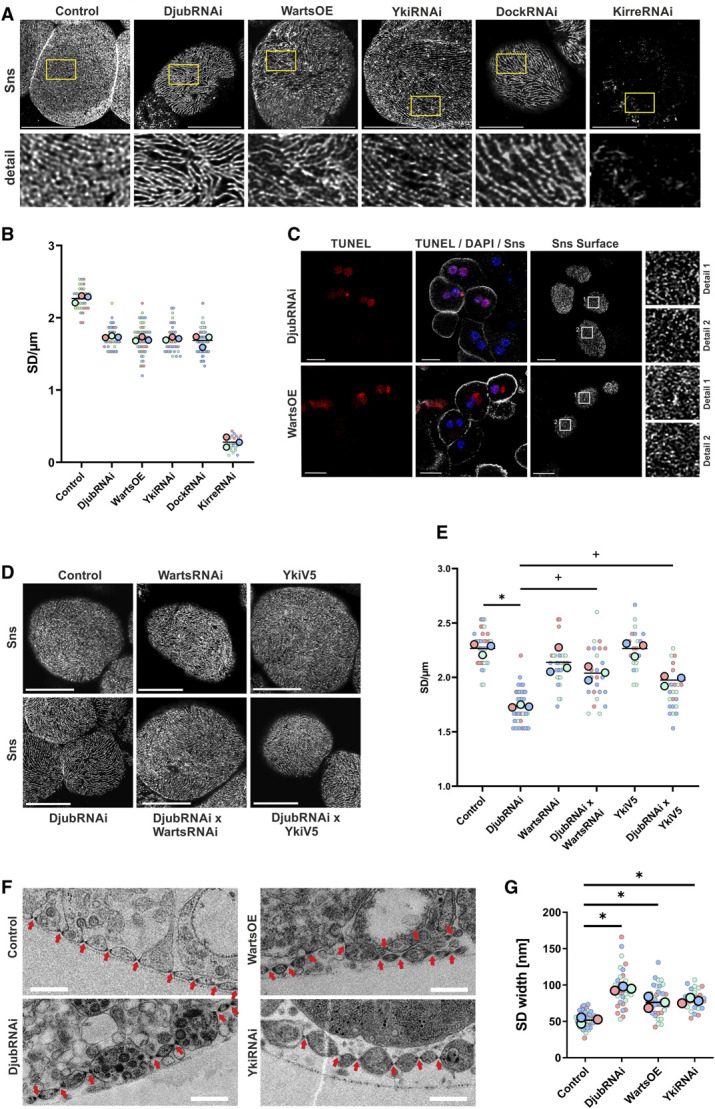
Knockdown of Djub and activation of Hippo pathway damage nephrocyte SD. (A) Immunostaining of Sns in third instar larvae garland nephrocytes as a SD marker. Knockdown of Djub, Yki, or Dock (DjubRNAi, YkiRNAi, DockRNAi) and WartsOE change the fingerprint-like structure of Sns on the surface, leading to increased distances between SDs with gaps in the structure. Scale bar 10 µm. (B) The statistical analysis of the number of Sns stained SDs crossing a 5-µm long line, drawn vertical to SDs, proves increased distances between SDs for mutants shown in (A) (>30 nephrocytes/genotype with three lines each). (C) Immunostaining of Sns in combination with TUNEL assays in nephrocytes with knockdown of Djub (DjubRNAi) and Warts OE after PFA fixation, which results in a somewhat shriveled surface. Red stained nuclei show TUNEL-positive nephrocytes; only DAPI (blue) stained nuclei show TUNEL-negative nephrocytes. The Sns-stained SD structures on the surface are completely comparable in TUNEL-positive and negative nephrocytes, which demonstrates that SD disturbances are independent from apoptotic processes. (D) Immunostaining of Sns in third instar larvae garland nephrocytes as a SD marker. As shown in (A), knockdown of Djub (DjubRNAi) changes the fingerprint-like structure of Sns on the surface, leading to increased distances between SDs. Warts knockdown or Yki overexpression simultaneous to Djub knockdown (DjubRNAi×WartsRNAi; DjubRNAi×YkiV5) partly rescues this effect. Warts knockdown (WartsRNAi) or Yki-V5 overexpression (YkiV5) alone has no effect. Scale bar 10 µm. (E) Statistical analysis of the number of Sns-stained SDs crossing a 5-µm long line, drawn vertical to SDs in nephrocyte mutants as shown in (C). Simultaneous Warts knockdown (DjubRNAi×WartsRNAi) or Yki-V5 overexpression (DjubRNAi×YkiV5) rescues the reduction of SD/µm observed in Djub-knockdown GCN. Warts knockdown (WartsRNAi) or Yki-V5 overexpression (YkiV5) alone had no effect on the number of SDs in comparison with control (n>15). (F) Transmission electron microscopy (TEM) of third instar larvae garland nephrocytes. Wild-type nephrocytes (control) show a regular arrangement of SDs (arrows). In DjubRNAi and YkiRNAi as well as Warts-overexpression nephrocytes, the distances between SDs are partly increased. In addition, in Warts overexpression, the arrangement of SDs seems to be partly disordered as sometimes a second row of SDs appears behind the front line. Scale bars 500 nm. (G) Quantification of SD width using TEM images of nephrocytes as shown in (E). *P < 0.05 compared with control, +P < 0.05 compared with DjubRNAi. Figure 4 can be viewed in color online at www.jasn.org.
