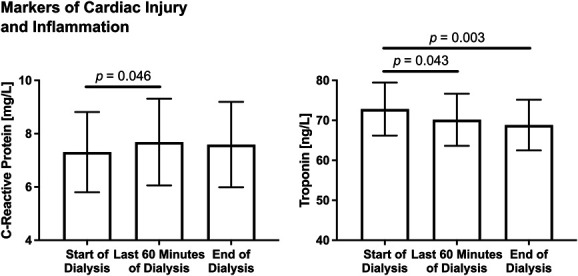
Figure 1.

Intradialytic changes in markers of vascular injury and inflammation (CRP and troponin) are shown. For both graphs, estimated marginal means and standard errors are plotted. Linear mixed model analysis showed a significant effect of time point for both CRP (F (2, 16)=3.962, P = 0.039) and troponin (F (2, 16)=8.154, P = 0.0035). Post hoc testing showed that CRP increased significantly from the start of the dialysis to the last 60 minutes of dialysis (P = 0.046) before normalizing back to starting levels at the end of dialysis. Post hoc testing also showed that cTnT decreased significantly from the start of dialysis to the last 60 minutes of dialysis (P = 0.043) and to the end of dialysis (P = 0.003). CRP, C-reactive protein.
