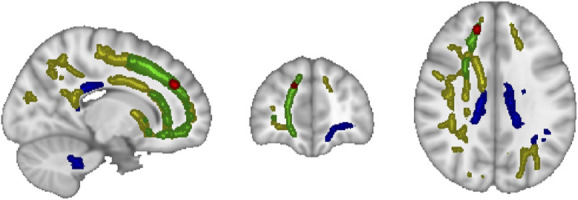
Figure 4.

Tract-based spatial statistics analysis revealed clustered areas of white matter with increased fractional anisotropy (blue), increased axial diffusivity (yellow), increased mean diffusivity (green), and increased radial diffusivity (red) during the last 60 minutes of dialysis (late-HD) relative to before dialysis (pre-HD). MNI coordinates: X=74, Y=171, Z=102. HD, hemodialysis.
