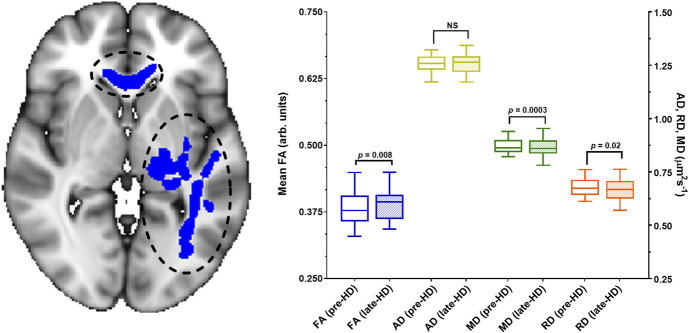
Figure 5.
Clusters of white matter showing significant differences in diffusion tensor imaging metrics (Figure 4) from before hemodialysis to the last 60 minutes of hemodialysis (late-HD) were used to define functional ROIs. The functional ROI where FA increased from pre-HD to late-HD (P = 0.008, blue bars) is shown here with black circles and blue fill. This functional ROI includes a portion of the corpus callosum and left inferior fronto-occipital fasciculus. Within this functional ROI, there was no significant change in AD (yellow bars) while mean diffusivity (P = 0.003, green bars) and radial diffusivity (P = 0.02, orange bars) decreased significantly from pre-HD to late-HD. Specifically, the percent changes in MD and RD at late-HD relative to pre-HD were 0.86%±1.52% (median = −0.76%) and −1.85%±2% (median = −1.71%), respectively. These changes are of a large magnitude, considering the annual rate of change in MD and RD in these regions is no more than ±0.67%.43 The MNI slice coordinate for the brain image shown is Z=72. AD, axial diffusivity; Arb, arbitrary; FA, fractional anisotropy; HD, hemodialysis; MD, mean diffusivity; NS, not statistically significant; RD, radial diffusivity; ROI, region of interest.

