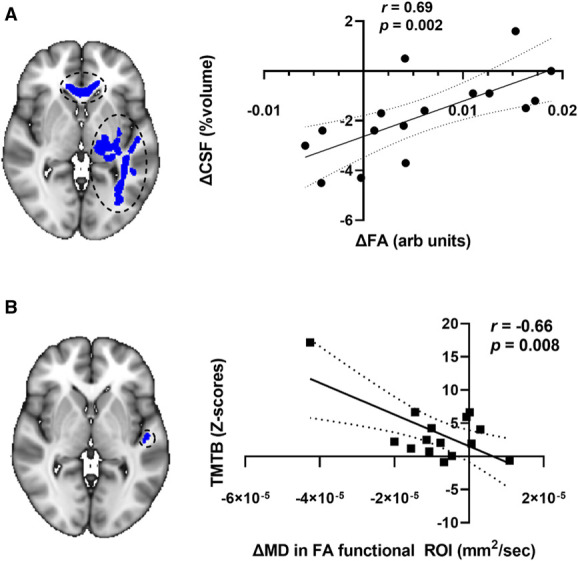
Figure 6.

Associations of changes in diffusion tensor imaging metrics and changes in CSF volume and cognitive test performance scores in white matter regions where tract-based spatial statistics revealed changes in FA. Large strength of association between change in mean FA (corpus callosum and left inferior fronto-occipital fasciculus) and change in mean CSF volume (A) and between change in TMT B z-scores and change in average MD (left inferior fronto-occipital fasciculus) (B) are shown. Note that the correlation shown in (B) did not meet the threshold for statistical significance after Bonferroni correction. The MNI coordinate for both brain images shown is Z=72. The linear regression (solid line) with 95% confidence intervals (dotted lines) is plotted. Arb, arbitrary; CSF, cerebrospinal fluid; FA, fractional anisotropy; MD, mean diffusivity; ROI, region of interest; TMT, Trail Making Test.
