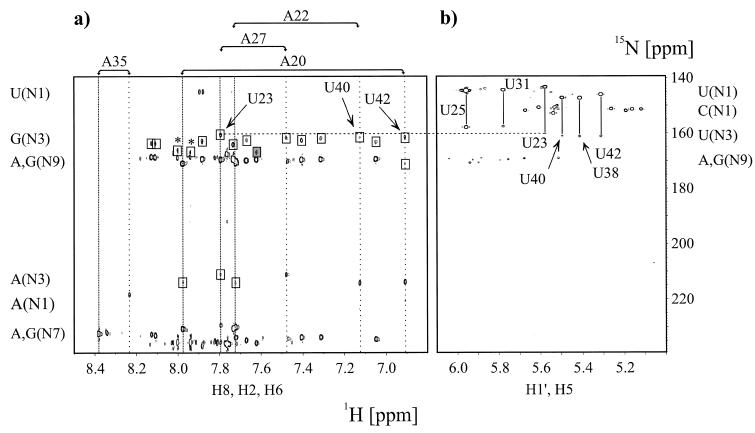
Figure 3.
Direct observation of scalar cross hydrogen bond 2hJ(N,N) and intraresidue 2J(N,N) coupling constants in the HIV-2 TAR–argininamide complex at 298 K in D2O. (a) Quantitative J-correlation 2JHN HNN–COSY spectrum recorded with the pulse scheme shown in Figure 2. Assignments for all adenosine residues in HIV-2 TAR are given on top of the spectrum. The corresponding H2 and H8 proton resonance frequencies are highlighted by vertical wide and narrow dotted lines, respectively. Cross peaks that are due to 2J(N,N) couplings have opposite signs and are shown in boxes. The unusual N3 chemical shift of G33 is shaded in dark gray. A dashed horizontal line connects the N3 resonance frequency of U23 as obtained from (a) 2JHN HNN–COSY and (b) nJHN HMQC experiments. Arrows point to the A20-U42 Watson–Crick base pair correlation, the A22-U40 correlation and to the A27-U23 correlation at the H8 proton resonance frequency of A27. Chemical shift regions for the nitrogen and proton resonances giving rise to the observable correlations are given next to the corresponding axis. Peaks marked with an asterisk are due to minor impurities from sample degradation. (b) Identification of cross-hydrogen bond couplings using intraresidual nJHN HMQC correlations. The applied delay duration 2Δ = 42 ms allowed a straightforward identification of H5,N1 and H5,N3 connectivities for uridine residues due to small intraresidue couplings (3JH5N1 ª 4.5 Hz, 3JH5N3 ª 2.5 Hz). Assignments for all uridine residues in HIV-2 TAR are given. The corresponding H5,N1 and H5,N3 cross peaks are connected by vertical solid lines. Chemical shift regions for the nitrogen and proton resonances giving rise to the observable correlations are given next to the corresponding axis.

