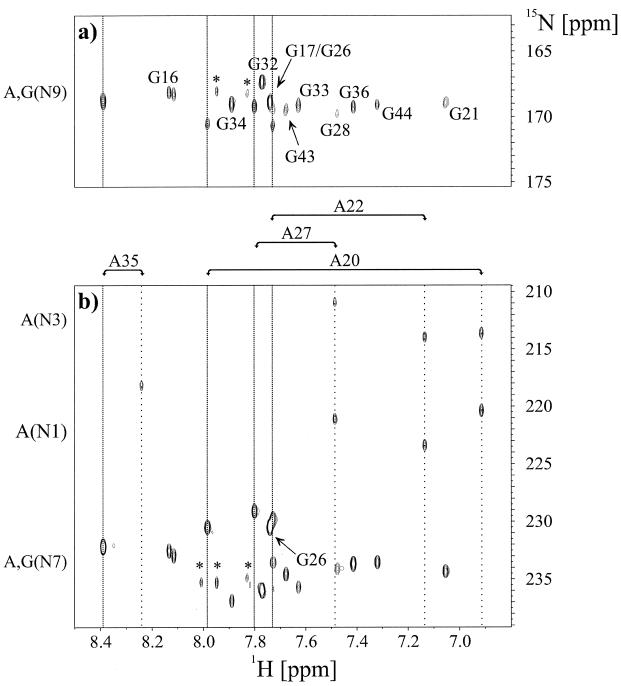
Figure 5.
Assignment of the purine non-exchangable nitrogens in the HIV-2 TAR–argininamide complex at 298 K in D2O. (a) Region of the 2JHN HMQC experiments showing H8,N9 cross peaks for adenosines and guanosines. Residue specific assignments for all guanosine residues in HIV-2 TAR are given. The H8 proton resonance frequencies of the adenosine residues are highlighted by vertical narrow dotted lines. (b) Region of the 2JHN HMQC experiments showing H8,N7 cross peaks for adenosine and guanosine residues as well as H2,N1/N3 crosspeaks for adenosine residues. Assignments for all adenosine residues in HIV-2 TAR are given on top of the spectrum (b). The corresponding H2 and H8 proton resonance frequencies are highlighted by vertical wide and narrow dotted lines, respectively. The N7 resonance of G26 interacting with the charged arginine guanidinium group is assigned. Chemical shift regions for the nitrogen resonances giving rise to the observable correlations are given. Peaks marked with an asterisk are due to minor impurities from sample degradation.

