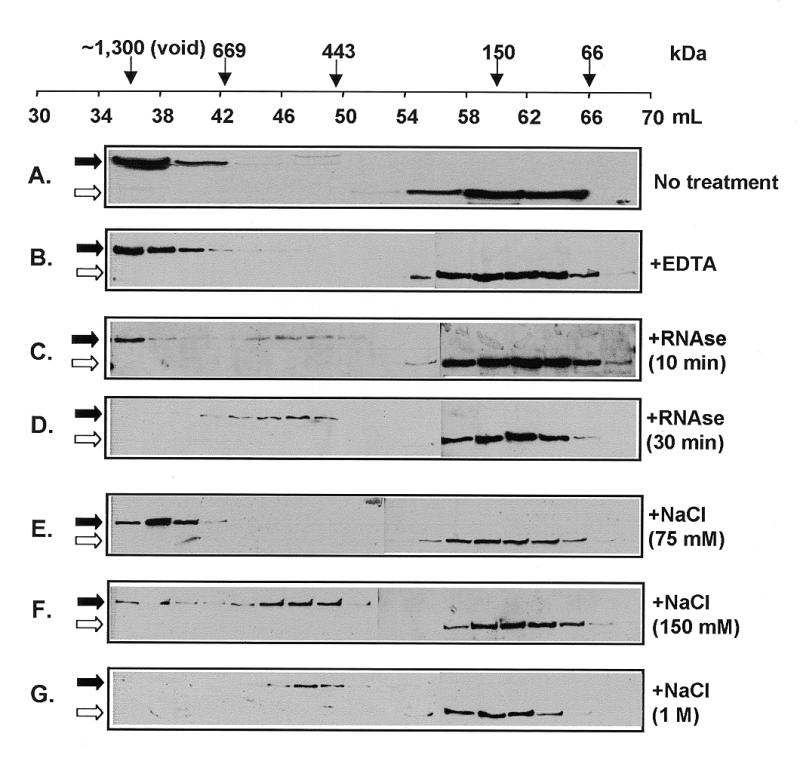
Figure 3.

Gel-filtration analysis of Scp160p-containing complexes. Cell lysates from yeast expressing FLAG–Scp160p were passed over a 120 ml S-300 Sephacryl column, and 2 ml fractions [except (A) where fractions were 4 ml] collected between 35 and 70 ml were assayed by α-FLAG western. Solid arrows indicate the position of the 160 kDa Scp160p band, the open arrows indicate the 100 kDa endogenous cross-reacting band. (A) No treatment, showing presence of FLAG–Scp160p in the void fractions. (B) Treatment with 30 mM EDTA, showing retention of Scp160p in the void fractions. (C) Treatment with 50 U/ml RNase for 10 min at room temperature, partially releasing a ~450 kDa complex. (D) Thirty minute RNase treatment, showing only the 450 kDa complex. (E) Treatment with 75 mM NaCl (F). Treatment with 150 mM NaCl. (G) Treatment with 1 M NaCl.
