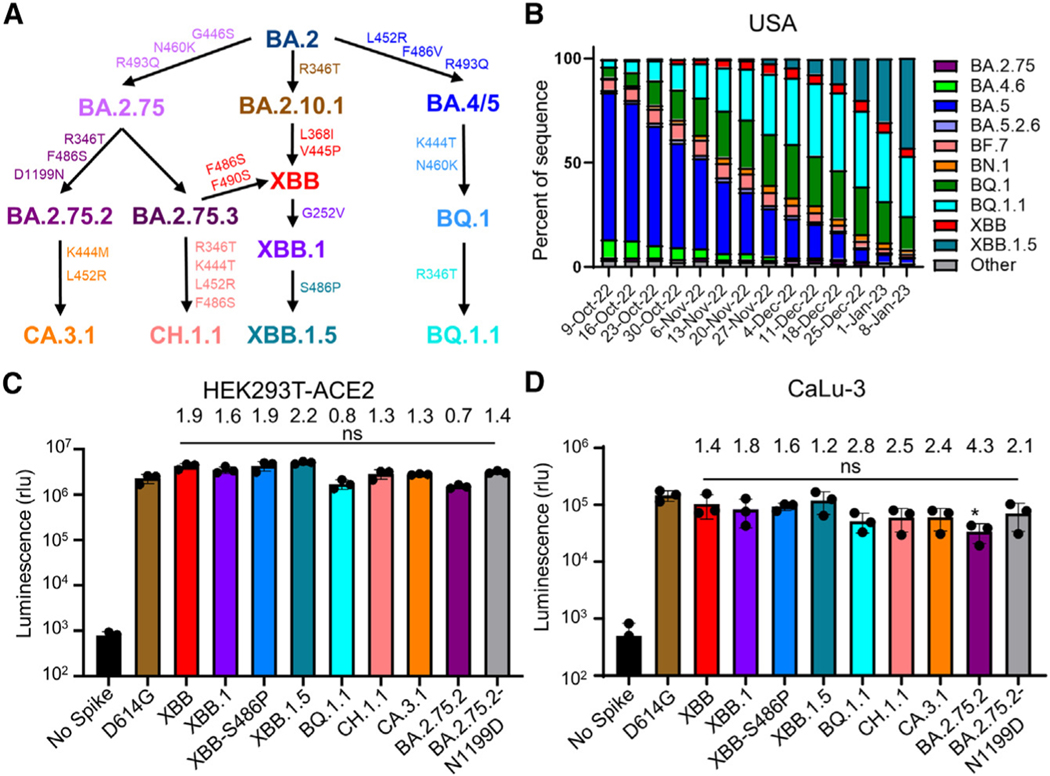
Figure 1. Distribution and infectivity of emerging Omicron subvariants XBB.1.5, CH.1.1, and CA.3.1.
(A) Schematic depiction of the relationships between different Omicron subvariants, with key lineage-defining amino acid mutations for each displayed.
(B) Distribution of recently emerged Omicron subvariants in the United States starting in early October of 2022 through the beginning of January 2023. Data were collected from the Centers for Disease Control and Prevention25 and plotted using Prism software.
(C and D) Infectivity of pseudotyped lentiviruses carrying each of the indicated S proteins of the Omicron subvariants were determined in (C) HEK293T cells overexpressing human ACE2 and
(D) human lung epithelia-derived CaLu-3 cells. Bars in (C) and (D) represent means ± standard deviation from three biological replicates of one typical experiment. Significance relative to D614G was determined using unpaired two-sided Student’s t tests (n = 3). p values are displayed as ns p > 0.05. The fold change in the mean viral titer of Omicron subvariants was calculated relative to that of D614G.

