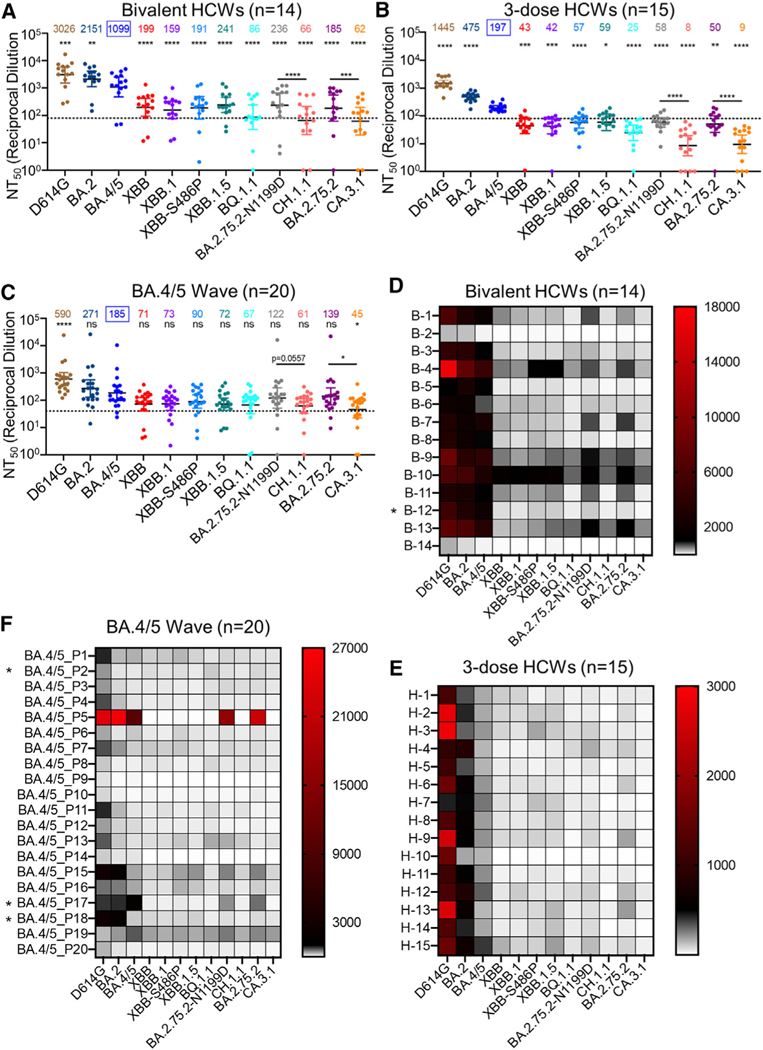
Figure 2. Neutralization of Omicron XBB.1.5, CH.1.1, and CA.3.1 subvariants by sera of bivalent or monovalent mRNA vaccinated healthcare workers (HCWs) and BA.4/5 wave infection.
Neutralizing antibody titers were determined using lentiviral pseudotypes carrying each of the indicated S proteins of the Omicron subvariants. They were compared against BA.4/5 and/or respective parental Omicron subvariants as specified in the text. The cohorts included sera from 14 HCWs that received 3 monovalent doses of mRNA vaccine plus a dose of bivalent mRNA vaccine (n = 14) (A and D), 15 sera from HCWs that only received three doses of monovalent mRNA vaccine (B and E), and 20 sera from BA.4/5-wave SARS-CoV-2-infected first responders and household contacts that tested positive during the BA.4/5 wave of infection in Columbus, Ohio (C and F). Bars represent geometric means with 95% confidence intervals. Geometric mean NT50 values are displayed for each subvariant on the top. Statistical significance was determined using log10-transformed NT50 values to better approximate normality. Comparisons between multiple groups were made using a one-way ANOVA with Bonferroni post-test. Comparisons between two groups were performed using a paired, two-tailed Student’s t test with Welch’s correction. Dashed lines indicate the threshold of detection (80 for monovalent and bivalent mRNA vaccinees and 40 for BA.4/5 infection cohort). p values are displayed as ns p > 0.05, *p < 0.05, **p < 0.01, ***p < 0.001, ****p < 0.0001. Heatmaps in (D)–(F) depict neutralizing antibody titers by each individual against each Omicron subvariant tested. Asterisk in (D) indicates the individual infected by SARSCoV-2 within 6 months before the sera sample collection, and asterisk in (F) indicates the individuals who had received three doses of mRNA vaccine before infection.

