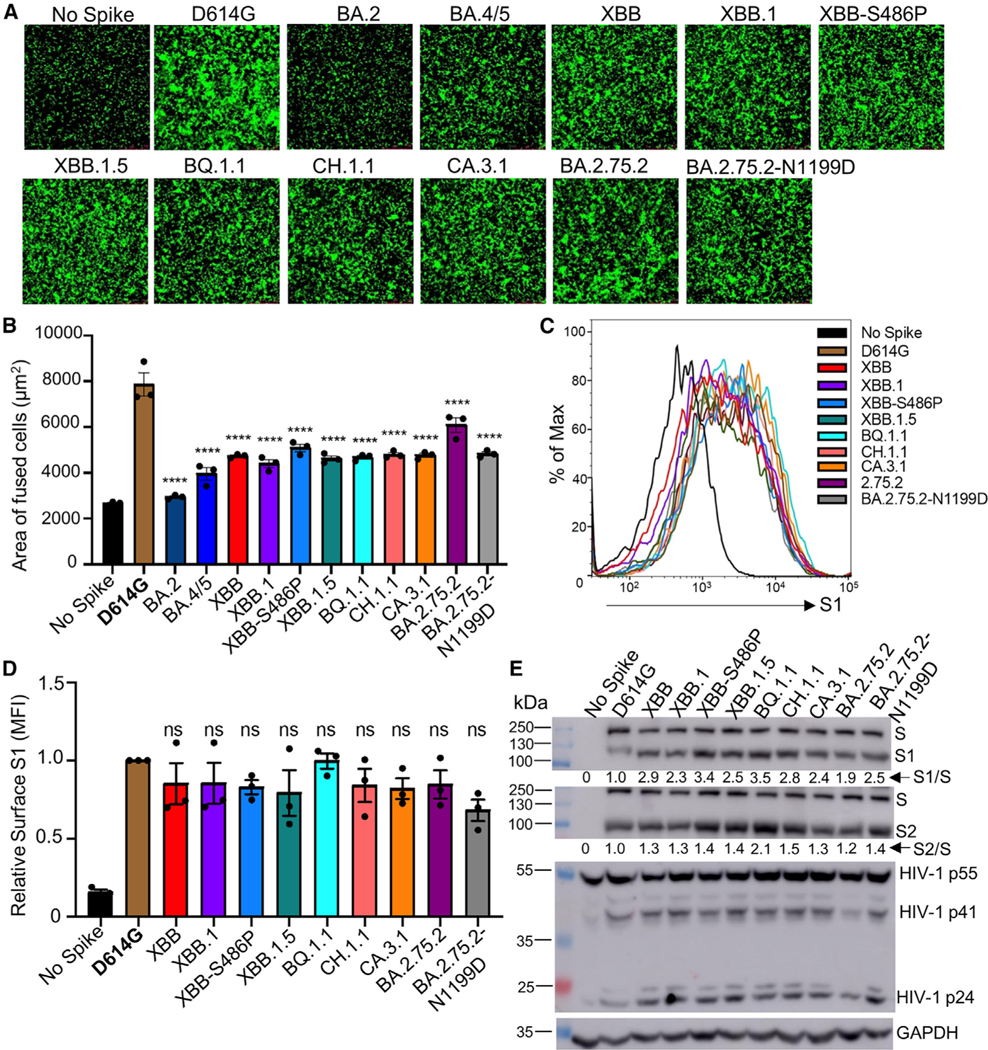
Figure 3. Syncytia formation, cell surface expression, and S processing of Omicron XBB.1.5, CH.1.1, and CA.3.1 subvariants.

(A and B) Syncytia-forming activity. HEK293T-ACE2 cells were co-transfected with Omicron subvariant S proteins and GFP and incubated for 30 h before (A) imaging and (B) quantifying syncytia. D614G and no S serve as positive and negative controls, respectively. Comparisons in the extent of syncytia for each variant were made against D614G, with p values indicating statistical significance. Similar results were obtained by using CaLu3 cell as target (see data in Figure S4).
(C and D) Cell surface expression of S proteins. HEK293T cells used for production of pseudotyped lentiviral vectors bearing S proteins (Figures 1 and 2) from Omicron subvariants were fixed and surface stained for S with an anti-S1 specific antibody T62 followed by flow cytometric analyses. (C) Histogram plots of anti-S1 signals in transfected cells and (D) calculated relative mean fluorescence intensities of each subvariant by setting the value of D614G as 1.
(E) S expression and processing. HEK293T cells used to produce pseudotyped vectors were lysed and probed with anti-S1, anti-S2, anti-GAPDH (loading control), or anti-p24 (HIV capsid, transfection control) antibodies; the signal for anti-GAPDH was from reblotting the membrane of anti-S1, and the signal for anti-S2 was from reblotting the membrane of anti-p24. S processing was quantified using NIH ImageJ used to determine an S1/S or S2/S ratio and normalized to D614G (D614G = 1.0).
Bars in (B) and (D) represent means ± standard error. Dots represent three biological replicates from one typical experiment. Significance relative to D614G was determined using a one-way repeated measures ANOVA with Bonferroni’s multiple testing correction (n = 3). p values are displayed as ns p > 0.05 and ****p < 0.0001.
