Figure. 2.

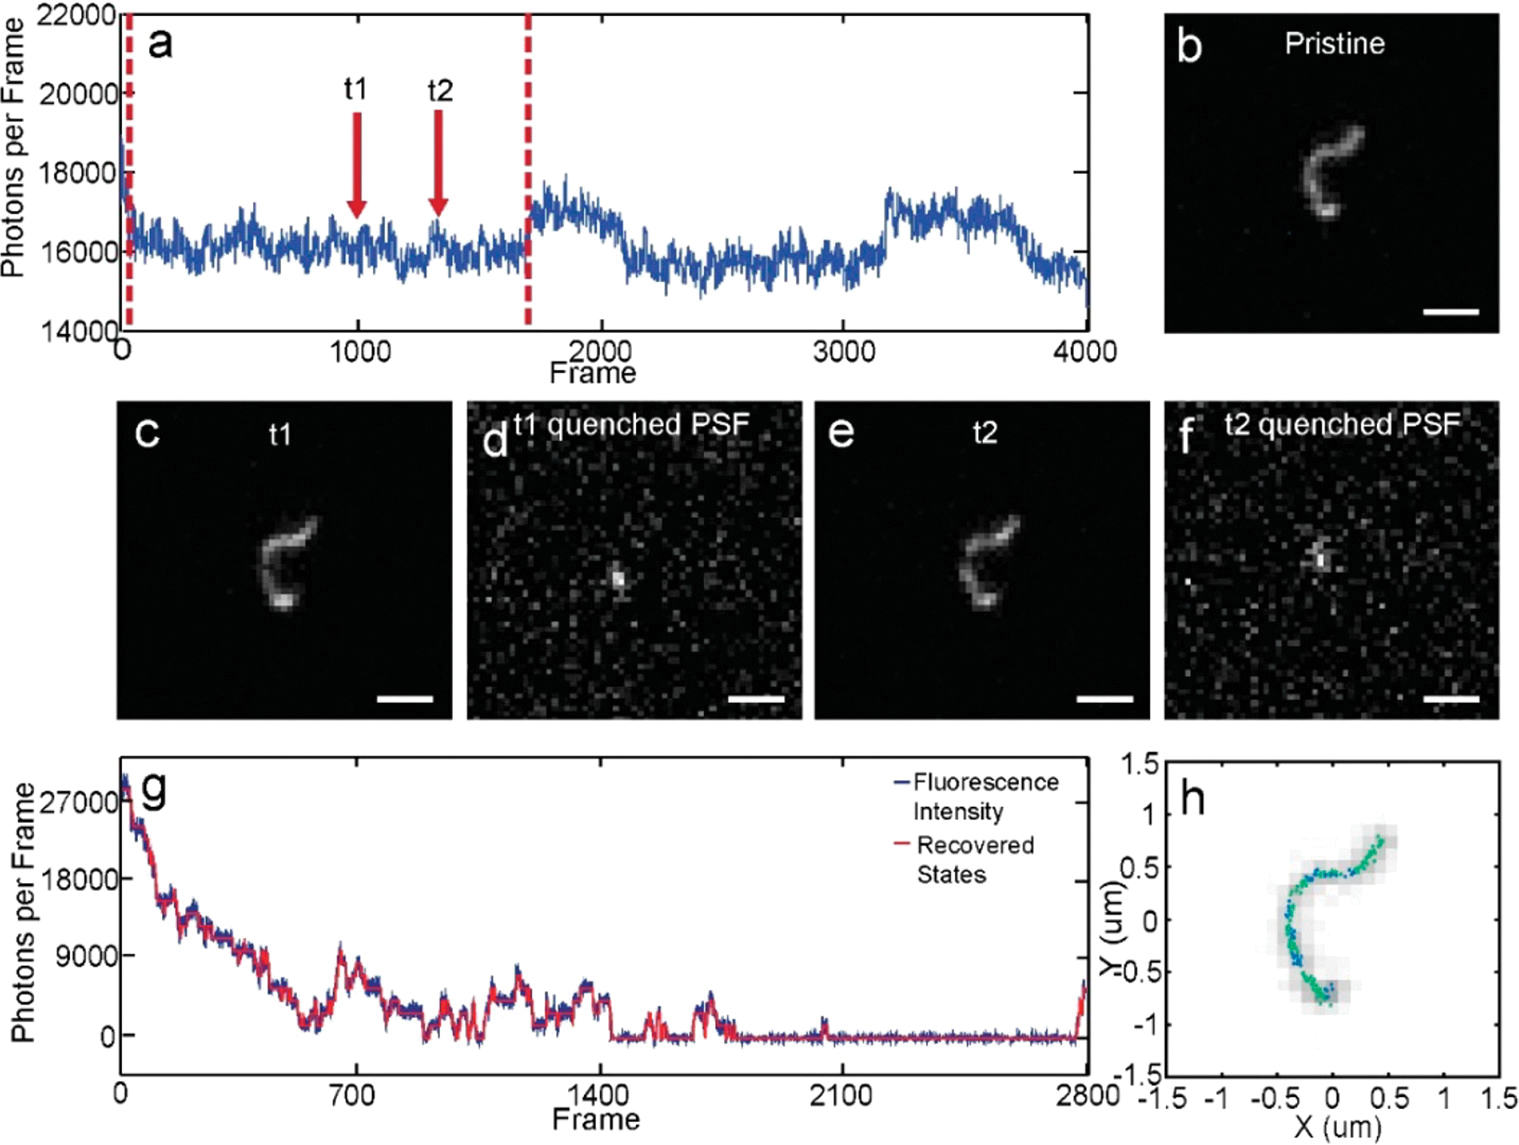
Hole polaron tracking and superresolution mapping of PFO nanowires. (a) Fluorescence intensity trajectory of a PFO nanowire, showing two-level blinking behavior. (b) A fluorescence microscopy image of the nanowire, before generation of any hole polaron. Scale bar: 1μm. (c) The fluorescence microscopy image of the nanowire after generation of a hole polaron, at t1. Scale bar: 1μm. (d) Quenched PSF, at t1. Scale bar: 1μm. (e) The fluorescence microscopy image of the nanowire after generation of a hole polaron, at t2. Scale bar: 1μm. (f) Quenched PSF, at t2. Scale bar: 1μm. (g) Fluorescence intensity trajectory of a PFO nanowire, showing binding and unbinding dynamics of MV2+. Quenching and recovery steps indentified were plotted in red. (h) Superresolution image of the corresponding nanowire, overlaid with the original, diffraction-limited image. The and phases were plotted in dark blue and cyan, respectively.
