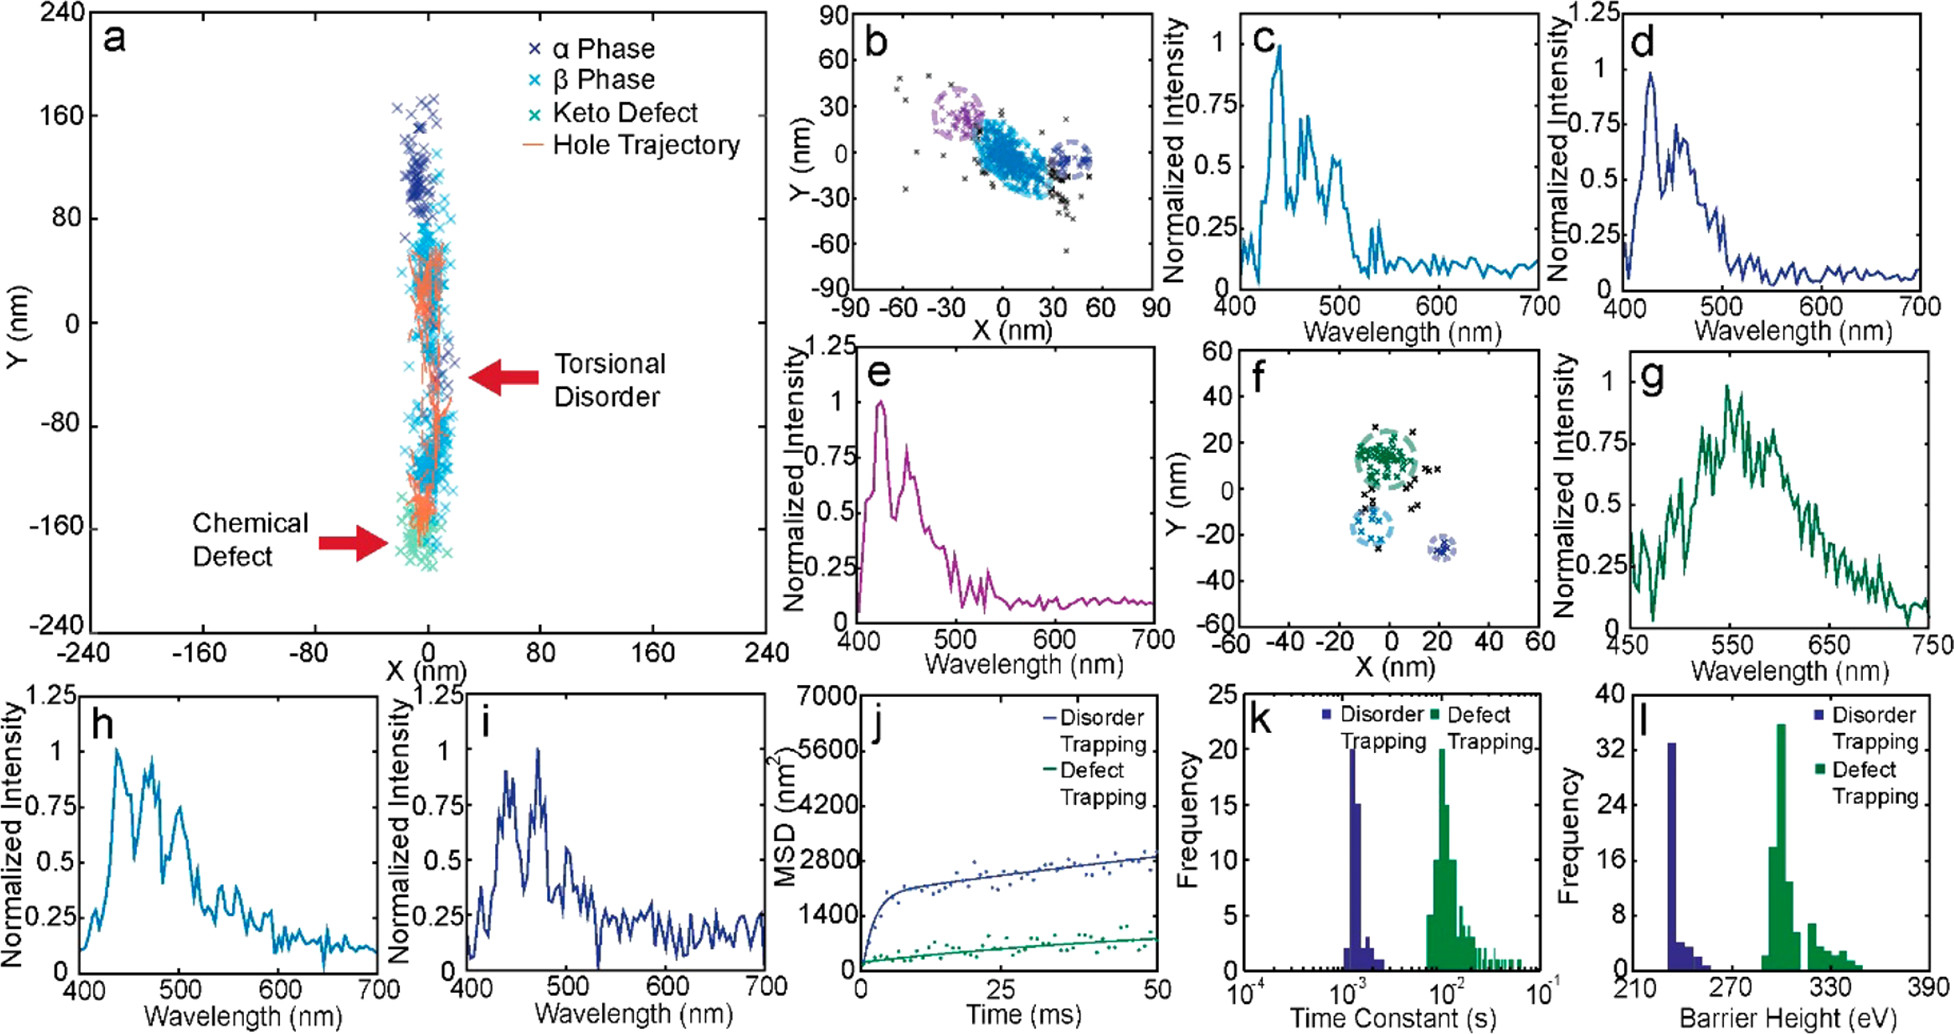
Figure. 4.

Hole polaron trapping in PFO nanowires. (a) Hole polaron trajectories overlaid with superresolution spectral map of a partially oxidized PFO nanowire. The color of the superresolution map indicates the peak wavelength of the local emission spectrum. Binning was performed to reduce the localization uncertainty to ~5 nm. (b) Localization scatter plot of a single polaron confined within a phase between two glassy areas. (c-e) The local emission spectra of the three regions shown in panel b, indicated by different colors. (f) Localization scatter plot of a single polaron trapped around a keto defect. (g-i) The local emission spectra of the three regions shown in panel f, indicated by different colors. (j) MSDs of hole polaron trajectory segments showing disorder trapping (blue) and defect trapping behavior (green), both fitted to a bi-exponential confined diffusion function. For defect trapping, , , . For disorder trapping, , . (k) Polaron escape time from glassy phase (blue) and keto defect (green). (l) Estimated depths of hole traps originated from torsional disorder (blue) and keto defects (green).
