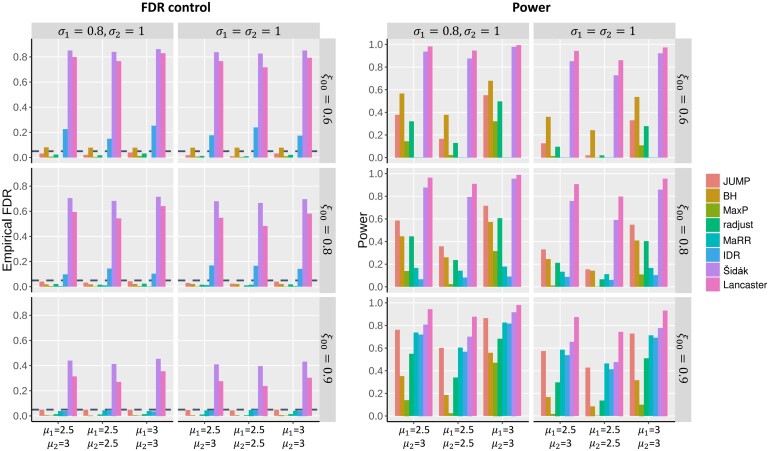
Figure 2.
FDR control and power comparison of different methods in simulation studies. and . Each row corresponds to different . Each column corresponds to different standard deviations. In each panel, the empirical FDR for different methods was calculated over 100 replications at a target FDR level of 0.05 (horizontal dashed line in the plots) for different non-null settings (left: ; middle: ; right: ).

