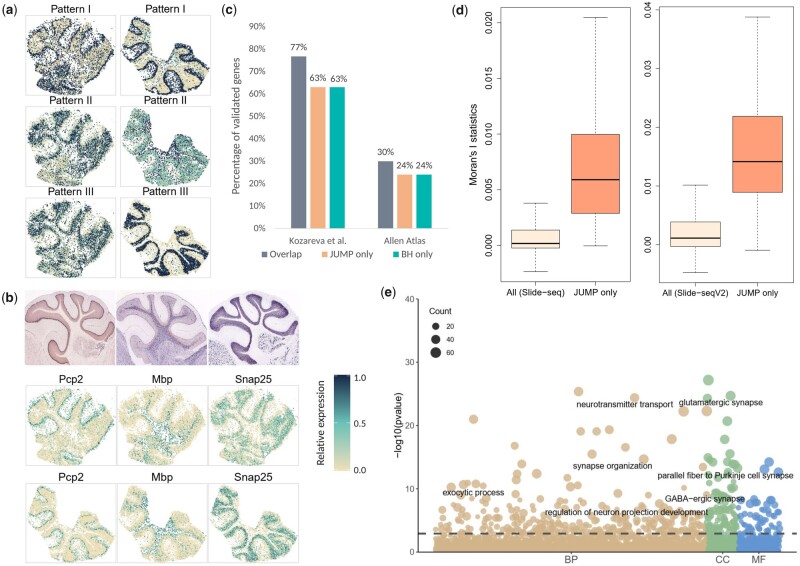
Figure 4.
Analysis and validation results of the mouse cerebellum data measured with Slide-seq technology and Slide-seqV2 technology. (a) Three distinct spatial expression patterns based on the 448 replicable SVGs identified by JUMP in the Slide-seq study (left) and Slide-seqV2 study (right). Each pattern summarizes the relative expression levels across spatial spots. (b) Spatial expression patterns of three representative genes identified by JUMP, corresponding to Patterns I–III, respectively. In situ hybridization images of corresponding genes obtained from the Allen Brain Atlas (atlas.brain-map.org) are shown in the top panel. (c) The bar chart displays the number of replicable SVGs additionally identified by JUMP and BH compared to that identified by all three methods. They were validated in two reference gene lists: one from Kozareva et al. (2021) and the other from the Allen Brain Atlas dataset summarized in the Harmonizome database. (d) The box plot shows Moran’s I statistic of the 169 replicable SVGs additionally identified by JUMP and that of all genes based on the Slide-seq study (left) and the Slide-seqV2 study (right). (e) The bubble plot shows the GO enrichment analysis result of JUMP, including different GO term categories: BP, CC and MF. The horizontal dashed line represents the FDR level 0.01. The size of a bubble represents the counts of corresponding gene sets.

