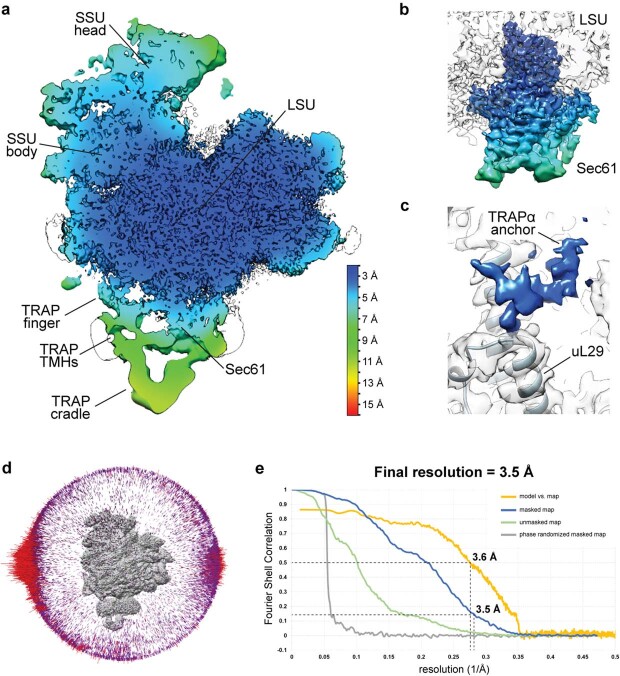
Extended Data Fig. 3. Local Resolution and Validation Plots.
a, Local resolution of the RNC-Sec61-TRAP complex calculated in RELION 3.1. Locally filtered map is showed (at 2.65σ), colored according to the resolution value. The scale bar is shown in the bottom right. b, Local resolution of the Sec61 translocon. Sec translocon map is shown at 2.4σ. Colors correspond to the same resolution as in panel (a). c, Local resolution of the TRAPα anchor. The map is shown at 3.6σ. For clarity, ribosome density was not colored according to the local resolution. Ribosomal protein uL29 that interacts with TRAPα anchor is indicated. d, Angular distribution of the particles in the two cryo-EM maps after final 3D refinements. e, Fourier Shell Correlation (FSC) plots and the model versus map plot, calculated using the gold standard FSC criteria cutoff (FSC = 0.143) using independent two half maps as implemented in RELION 3.1, and the cutoff for the resolution of the model is determined based on the FSC cutoff (FSC = 0.5).

