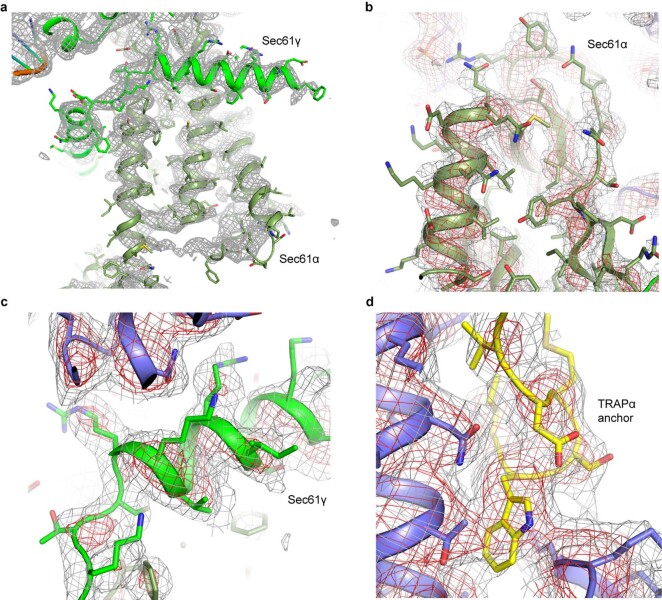
Extended Data Fig. 4. Cryo-EM density for the high-resolution areas of Sec61 and TRAP complexes.
a–c, Cryo-EM densities corresponding to the transmembrane α-helices of the Sec61α and Sec61α subunits. Cryo-EM density is shown as mesh and shown at two different contour levels and colored gray and red. Atomic coordinates are show as cartoon and sticks. Maps shown as gray mesh at 3.7σ (a), 4σ (b) and 3.3σ (c). d, Cryo-EM density corresponding to the TRAP anchor. Gray mesh shown at 3.5σ.

