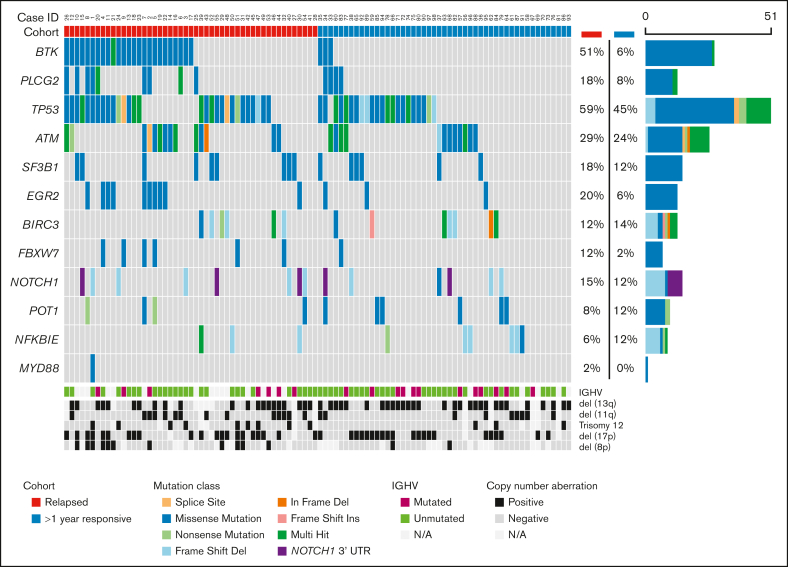
Figure 1.
Oncoplot displaying the somatic variants detected in the 13 genes analyzed by a HaloPlex high sensitivity custom panel in the relapsed and responding cohorts. Illustrated are the distribution of the somatic variants, IGHV mutational status, cytogenetic profile determined by fluorescence in situ hybridization or lymphoid panel (del[8p]), and the mutation frequency of each gene in the relapsed and responding cohorts, respectively. Patient identifiers are indicated across the top row.

