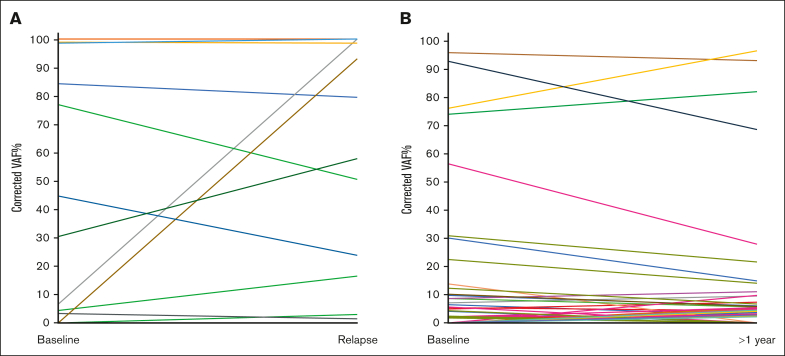
Figure 2.
TP53 clonal dynamics in the relapsed and responsive cohorts. (A) TP53 clonal dynamics in 10 mutated patients of the relapsed cohort. Each patient is represented by a different color. The vertical axis displays the mutation VAF%, corrected according to the % of CD19+ cells in the sample. Two patients were not included in the chart because of missing CD19+ purity data. (B) TP53 clonal dynamics in 18 mutated patients of the responsive cohort. Each patient is represented by a different color. The vertical axis displays the mutation VAF%, corrected according to the % of CD19+ cells in the sample. Three patients were not included in the chart because of the missing CD19+ purity data.

