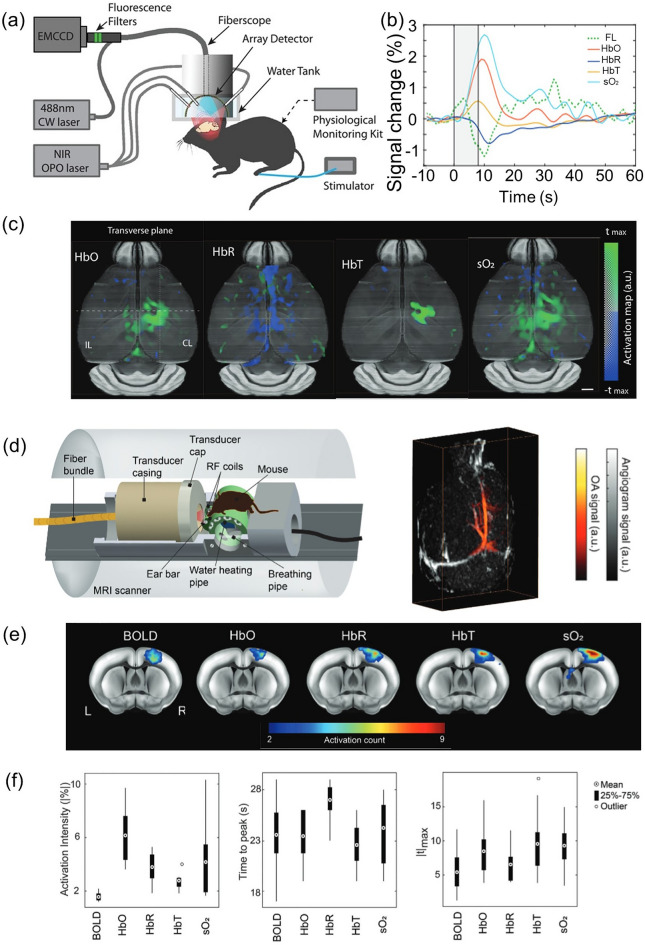
Fig. 11.
Simultaneous observation of neurovascular hemodynamic activity using fluorescence optoacoustic tomography (FLOT) and magnetic resonance optoacoustic tomography (MROT). a Configuration of the hybrid FLOT system for imaging mouse brain activation. b Average fractional changes of biomarkers—fluorescence, HbO2, HbR, HbT, and SO2—in response to an electrical paw stimulation burst. c Functional optoacoustic activation maps in transverse view corresponding to each biomarker. d The hybrid MROT system schematic with a representative 3D-coregistered MR angiogram and PA tomographic volume. e Activation count maps overlaid on the mouse brain atlas for MROT biomarker changes. f Statistical distributions of neural response parameters from the somatosensory forelimb region in the averaged time-courses. CW, continuous wave; NIR, near-infrared; OPO, optical parametric oscillator; FL, fluourescence; HbO, oxygenated hemoglobin; HbR, reduced hemoglobin; HbT, total hemoglobin; SO2, oxygen saturation; tmax, time-to-maximum; OA, photoacoustic; BOLD, blood oxygen level-dependent signal. The images are reproduced with permission from [171, 172]

