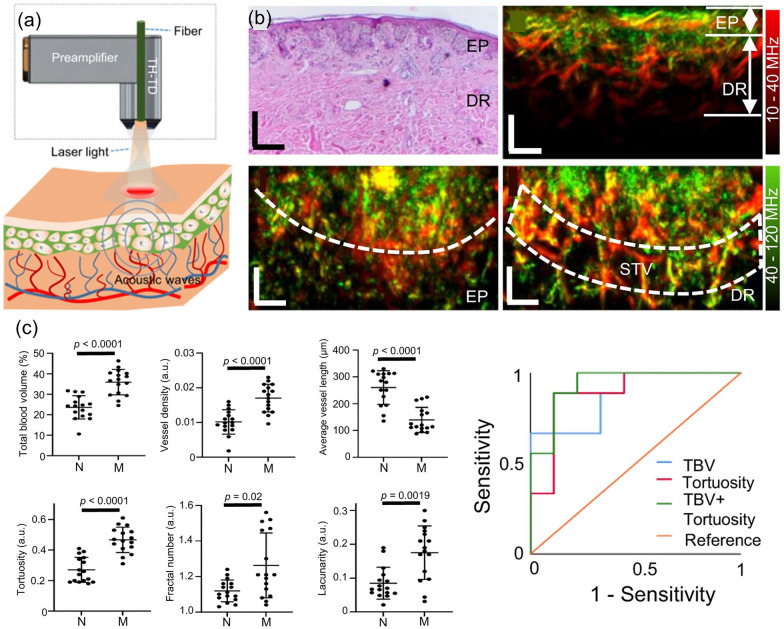
Fig. 8.
Single-breath-hold scan of human melanoma vasculature in vivo with accelerated FRSOM. a Schematic of a through-hole transducer implementation in an FRSOM setup. b Histological image (top, left) and cross-sectional MIP images (top, right) of human melanoma in vivo. The coronal-direction MIP at epidermal depth range (bottom, left) and dermal depth range (bottom, right) visualize the separation boundary between pigmented lesion and surrounding skin tissue, and surrounding tissue vessels beneath extending toward healthy skin tissue, respectively (marked with white dashed line). c Statistical comparison of computed vessel biomarkers between a normal nevus and melanoma lesions, and resultant ROC plots of melanoma differentiation with various biomarker combinations. All scale bars = 500 μm. TH-TD, through-hole transducer; EP, epidermis layer; DR, dermis layer; STV, surrounding tissue vessels; N, nevi; M, melanoma; a.u., arbitrary unit; TBV, total blood volume. The images are reproduced with permission from [85]

