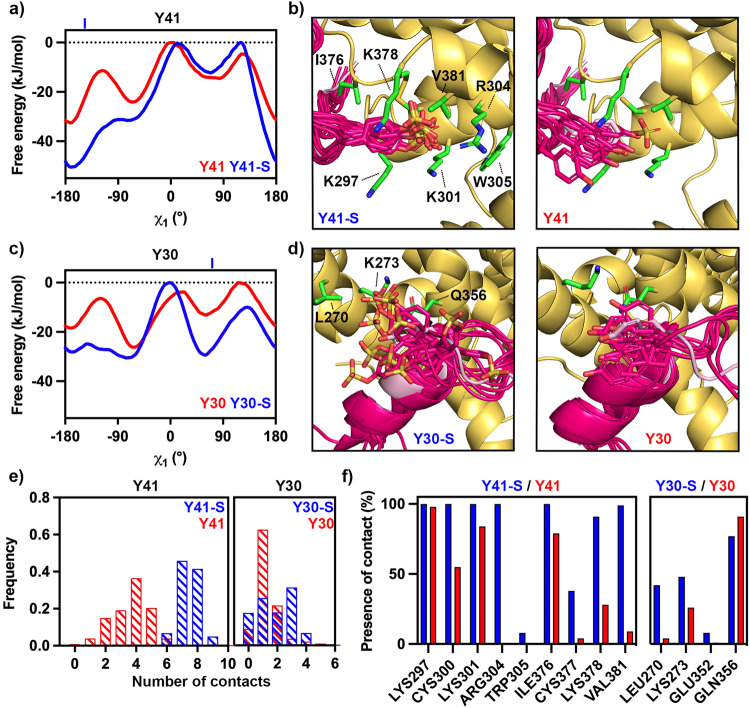
Fig. 2. Molecular dynamics simulations indicate ordered binding of Y41 but not Y30.
a Free energy landscapes for residue Y41 sulfated (blue) and non-sulfated (red) relative to the χ1 angle of the tyrosine, showing that sulfation favours a single binding position. In the crystal structure, χ1 = −144.3°, indicated by a blue line above the graph. b Representative images from across the simulation, showing the degree of motion of Y41 in its sulfated (left) and non-sulfated (right) forms. In each case, PvDBP is yellow and DARC is bright pink. The crystal structure is shown for comparison in light pink. In each case, sulfate atoms are yellow, oxygen atoms red and nitrogen atoms blue. c Free energy landscapes for residue Y30 sulfated (blue) and non-sulfated (red) relative to the χ1 angle of the tyrosine, showing that sulfation disfavours a single binding position. In the crystal structure, χ1 = 71.6°, indicated by a blue line above the graph. d Representative images from across the simulation, showing the degree of motion of Y30 in its sulfated (left) and non-sulfated (right) forms, coloured as in b). e The frequency of the number of contacts formed between PvDBP-RII and Y41 (left) and Y30 (right) in the sulfated (blue) and non-sulfated (red) forms during the simulations. f The percentage of frames from across the simulation in which each residue from PvDBP forms interactions with Y41 (left) and Y30 (right) in the sulfated (blue) and non-sulfated (red) forms. Source data are provided as a Source data file.

