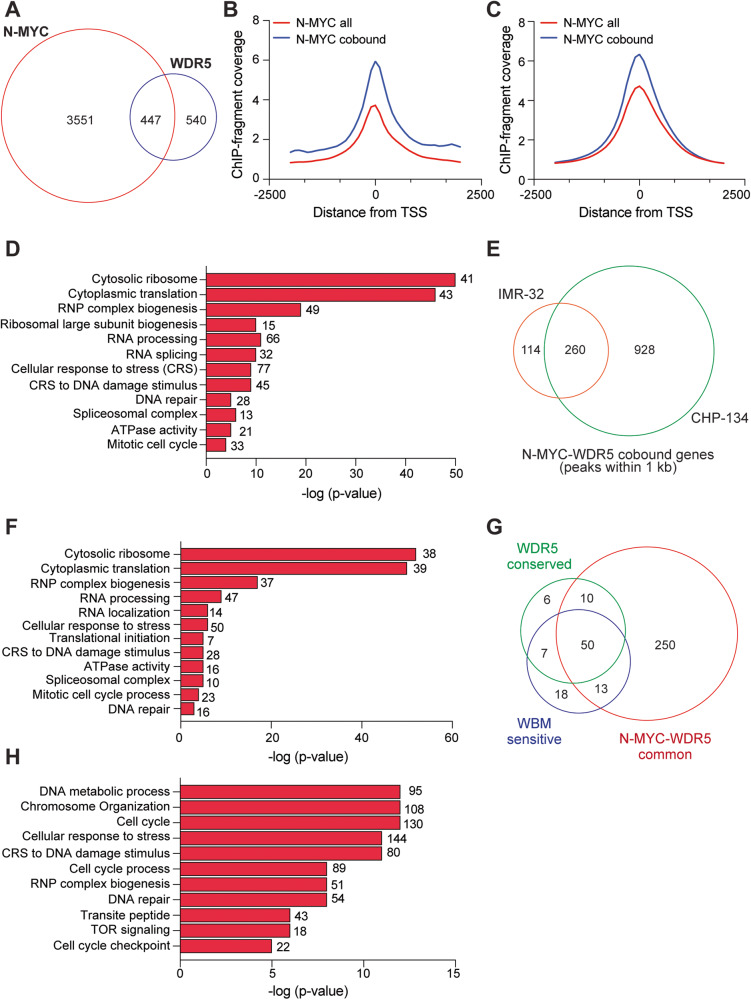
Fig. 4. Colocalization of N-MYC and WDR5 on chromatin in IMR-32 cells is similar to CHP-134 cells.
A Venn diagram showing the overlap between total peaks detected for N-MYC and WDR5 in IMR-32 cells. Overlap was called if individual peaks fall within 1 bp of each other. B Average normalized ChIP-seq fragment coverage for N-MYC at all sites centered at the TSS (red) compared to N-MYC at N-MYC–WDR5 cobound sites (blue) in IMR-32 cells. C Average normalized ChIP-seq fragment coverage for N-MYC at all sites centered at the TSS (red) compared to N-MYC at N-MYC–WDR5 cobound sites (blue) in CHP-134 cells. D Gene ontology enrichment analysis of genes that show N-MYC–WDR5 colocalization within 1 kb of their TSS in IMR-32 cells. The significance of enrichment is located on the x-axis and the numbers next to the red bars are the number of genes in each category. E Venn diagram showing the overlap between N-MYC–WDR5 cobound genes in each cell line. Only genes showing N-MYC–WDR5 bound within 1 kb of the gene were included. F Gene ontology enrichment analysis of 260 common genes from (E). Significance of enrichment is located on the x-axis and the numbers next to the red bars are the number of genes in each category. G Venn diagram showing the overlap of common N-MYC–WDR5 cobound sites with the conserved WDR5 binding sites across human cell lines [15] or c-MYC binding sites that are WBM-sensitive [9]. H Gene ontology enrichment analysis of 928 N-MYC-WDR5 cobound genes from (E) that are specific to CHP-134 cells. Significance of enrichment is located on the x-axis and the numbers next to the red bars are the number of genes in each category. RNP ribonucleoprotein.

