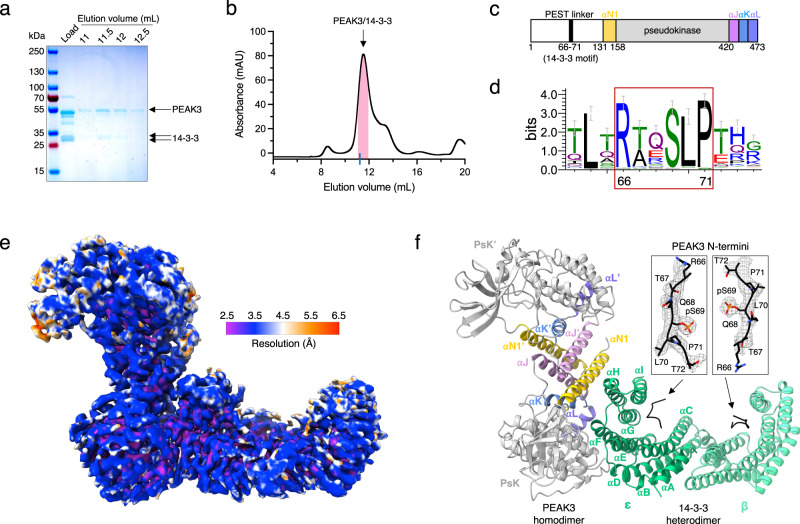
Fig. 1. Structure of the PEAK3/14-3-3 complex.
a Representative Coomassie-stained SDS-PAGE gel analysis of the purified PEAK3/14-3-3 complex and b corresponding size exclusion chromatography profile resolved on a Superdex 200 10/300 Increase column. Pink bar on the chromatogram indicates collected fractions. Blue tick on the x-axis represents the elution volume of Bovine γ-globulin (158,000 Da) as a reference for the PEAK3/14-3-3 tetrameric complex (161,801 Da). SDS-PAGE and size exclusion chromatography results are representative of at least 3 independent experiments. c Cartoon schematic of PEAK3 domain structure depicting location of the 14-3-3 binding site. d Sequence logo (Weblogo) demonstrating conservation of the 14-3-3 binding site in PEAK3 across evolution. PEAK3 homolog sequences were collected by BLAST search in the Refseq database and clustered at 80% sequence identity. e Cryo-EM map of the PEAK3/14-3-3 complex colored according to local resolution determined by ResMap. f Structure of the PEAK3/14-3-3 complex and zoomed-in view of PEAK3 N-terminal 14-3-3 consensus binding sites superimposed with the cryo-EM map, demonstrating occupancy of both canonical substrate binding grooves in 14-3-3 by phosphorylated 14-3-3 consensus sequences of PEAK3. PEAK3 pseudokinase domains (PsK and PsK’) are in gray and the resolved regions of the N-terminal PEST linkers are shown in black. SHED domain helices αN1 are in yellow, αJ in pink, αK in blue, and αL in purple. 14-3-3ε is shown in green and 14-3-3β is shown in light green.

