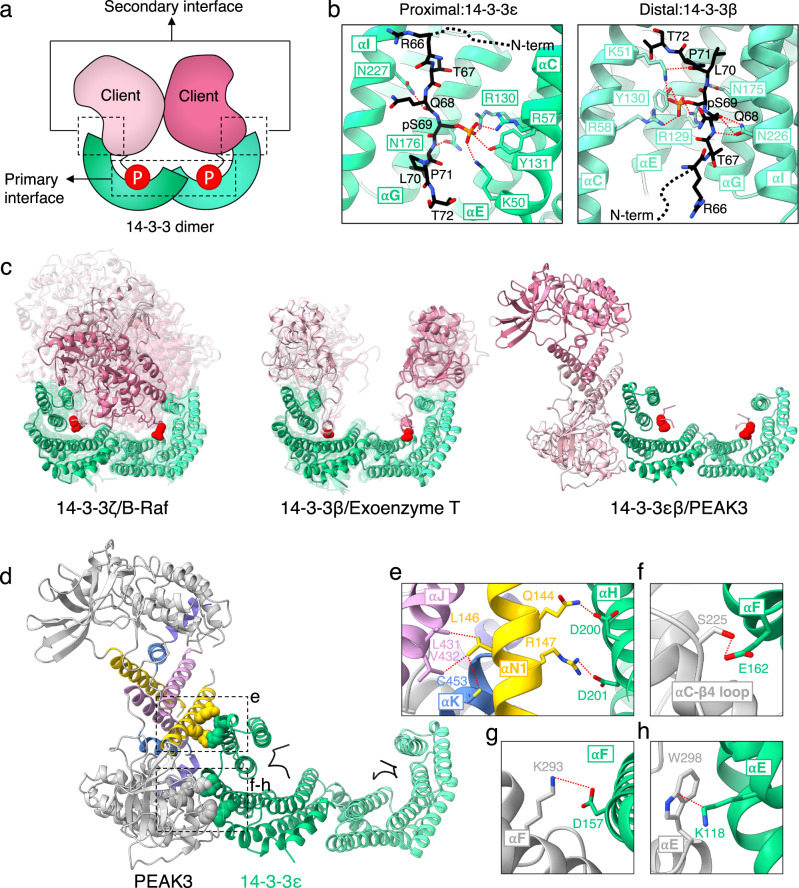
Fig. 3. Asymmetric binding mode of the PEAK3/14-3-3 complex.
a Cartoon depicting primary and secondary interactions within a 14-3-3/client complex. b PEAK3 binding to the amphipathic grooves of 14-3-3ε and 14-3-3β, highlighting key conserved interactions. c Known binding modes of 14-3-3/client complexes found in the Protein Data Bank. 14-3-3 monomers are shown in green and light green, 14-3-3 substrate monomers are shown in pink and light pink, and phosphorylated residues or phosphomimetics which engage the 14-3-3 binding grooves are shown as red spheres. See Methods for alignment details. d PEAK3/14-3-3 structure highlighting PEAK3 SHED domain (box e) and pseudokinase domain (box f-h) interactions with 14-3-3ε. e-h Zoomed-in view of PEAK3/14-3-3ε secondary interface, highlighting key interactions. Dashed lines in red indicate interactions with distances ≤ 4 Å.

